Fig. A.2.
Download original image
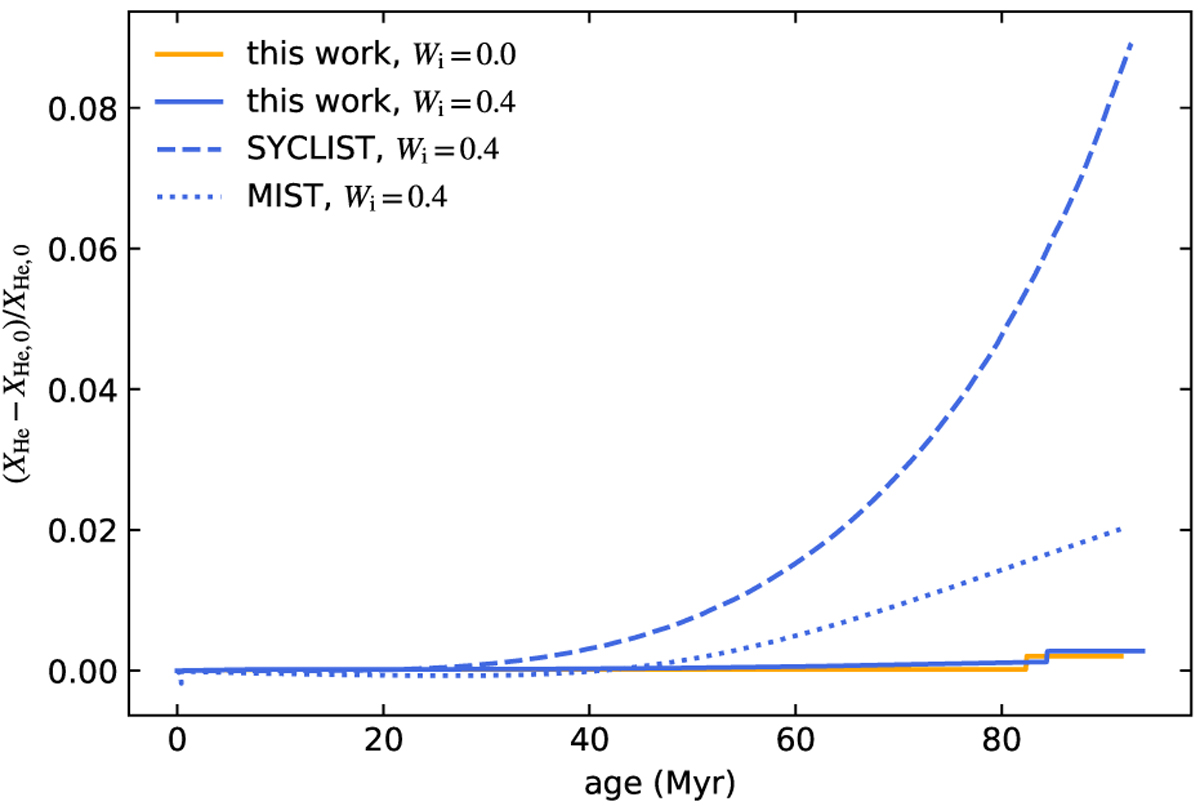
Surface helium enhancement of 5 M⊙ SMC stellar models as a function of stellar age. The y-axis shows the increase of the surface helium abundance of the stellar models with respect to their initial abundance. Here XHe and XHe, 0 are the current surface helium abundance and the initial surface helium abundance of the stellar models, respectively. The orange solid line corresponds to our nonrotating MESA models, while the solid, dashed, and dotted blue lines correspond to our MESA models, the SYCLIST models, and the MIST models that initially rotate at 40% of their critical velocities.
Current usage metrics show cumulative count of Article Views (full-text article views including HTML views, PDF and ePub downloads, according to the available data) and Abstracts Views on Vision4Press platform.
Data correspond to usage on the plateform after 2015. The current usage metrics is available 48-96 hours after online publication and is updated daily on week days.
Initial download of the metrics may take a while.