Fig. 5.
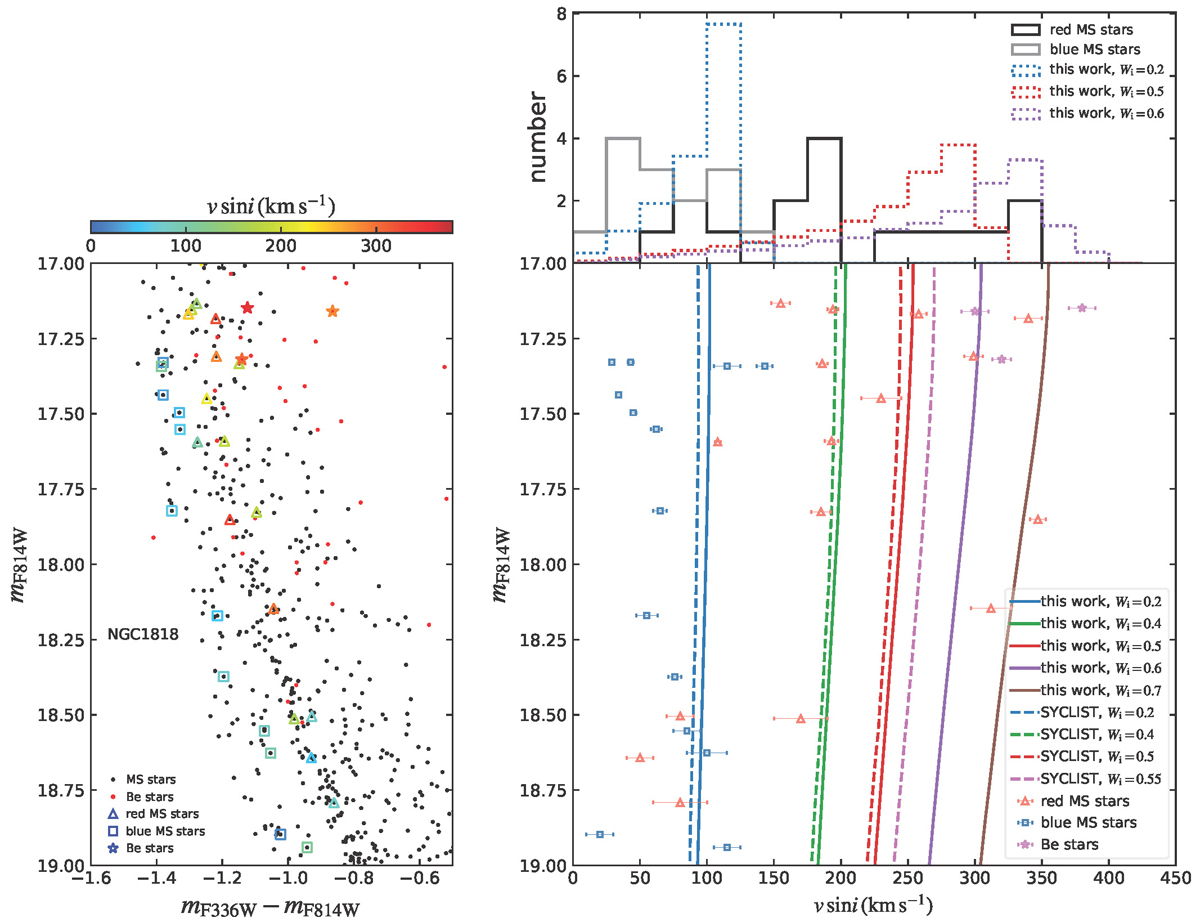
Download original image
Comparison between the predicted and the observed rotational velocities. Left: a zoom-in image of the main-sequence stars in NGC 1818 which have magnitudes between 17 and 19. The black and red dots correspond to the normal main-sequence stars and Hα emitters, respectively. The open symbols mark the stars that have spectroscopic rotational velocity measurements (Marino et al. 2018), with color indicating their measured projected rotational velocity vsin i values. Here i is the inclination. The red main-sequence stars, blue main-sequence stars, and Be stars with Hα emission lines are designated by triangles, squares and asterisks, respectively. Lower right: comparison between the model predicted average surface equatorial velocity and the spectroscopic measurements. The open symbols with error bars correspond to the observations, using the same symbol types as the left panel. The solid lines and dashed lines represent the average surface equatorial velocity (times π/4 to account for a random orientation) of our MESA models at 30 Myr and the SYCLIST models at 40 Myr (the ages used in our isochrone fitting). Color coding is the same as in Fig. 1. Upper right: comparison between our theoretical predicted vsini distributions (color dotted steps) and the observed vsini distributions of the red (solid black steps) and the blue (solid gray steps) main-sequence stars. For the theoretical predictions, we perform a Monte Carlo simulation by assuming a random orientation angle distribution and normalize the results to a total number of 15 for each initial rotation, which is similar to the number of the blue (14) and red main-sequence (16) stars that have spectroscopic observations.
Current usage metrics show cumulative count of Article Views (full-text article views including HTML views, PDF and ePub downloads, according to the available data) and Abstracts Views on Vision4Press platform.
Data correspond to usage on the plateform after 2015. The current usage metrics is available 48-96 hours after online publication and is updated daily on week days.
Initial download of the metrics may take a while.