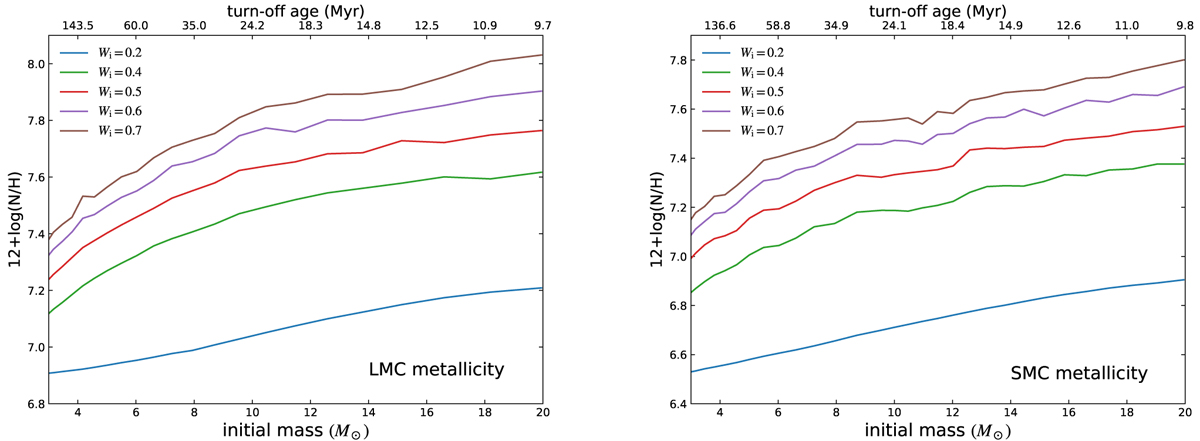
Fig. 4.
Download original image
Surface N abundances for our MESA models with the LMC metallicity (left) and the SMC metallicity (right) at the end of their main sequences when 1% of H is left in the stellar center. The x-axis shows the initial mass of the stellar models, with the corresponding cluster turn-off ages shown on the top x-axis. Solid lines with different colors indicate different initial rotational rates.
Current usage metrics show cumulative count of Article Views (full-text article views including HTML views, PDF and ePub downloads, according to the available data) and Abstracts Views on Vision4Press platform.
Data correspond to usage on the plateform after 2015. The current usage metrics is available 48-96 hours after online publication and is updated daily on week days.
Initial download of the metrics may take a while.