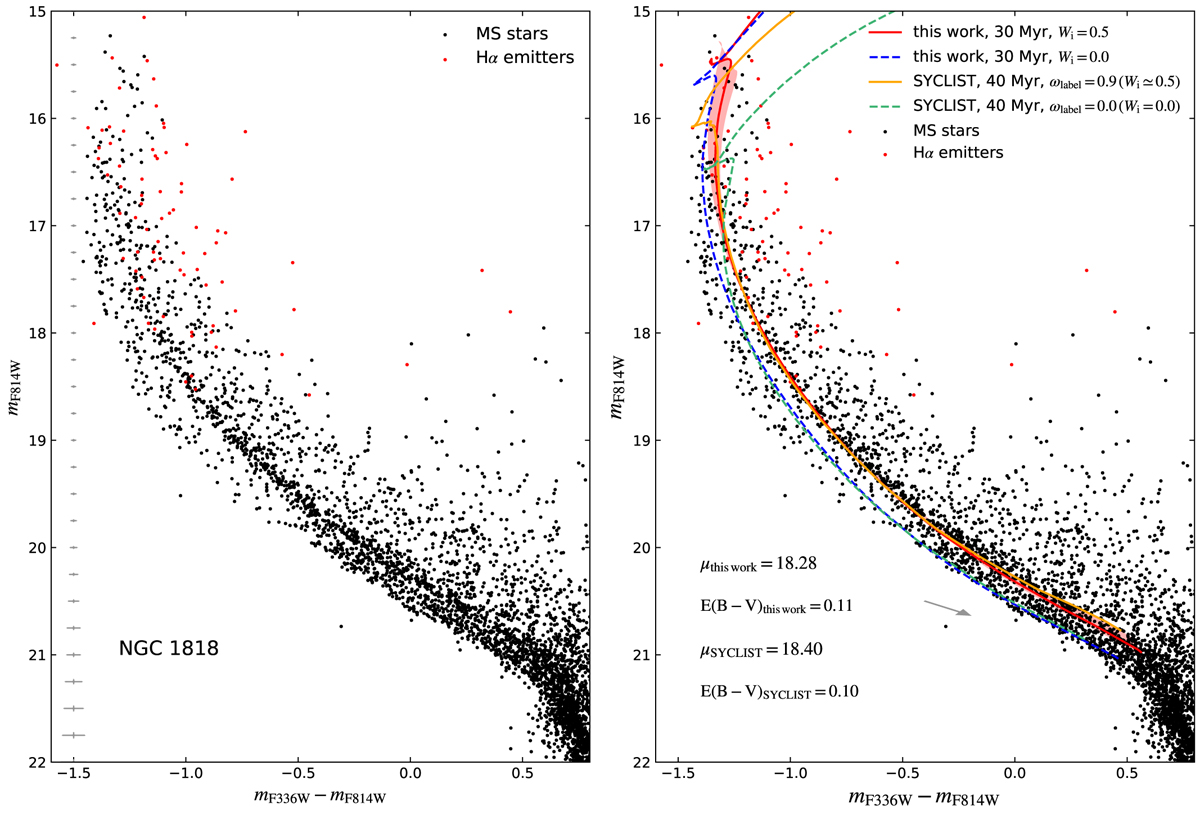
Fig. 2.
Download original image
Isochrone fitting to the main-sequence stars in the LMC cluster NGC,1818. Left: distribution of the main-sequence stars in NGC 1818 observed by HST. The black and red dots are normal MS stars and the stars with a brightness excess in the Hα narrow band filter, respectively. The gray error bars on the left indicate 1σ photometric uncertainties at corresponding magnitudes. Right: isochrone fitting to the red and blue MSs of NGC 1818, using the SYCLIST models and our MESA models. For the SYCLIST models, we take the fit in Milone et al. (2018), using 40 Myr isochrones of the nonrotating models and the models with labeled 90% of critical angular velocities (roughly equal to 50% of critical linear velocities under the MESA definition) to fit the observed blue and red MSs, indicated by the solid orange and the dashed green lines, respectively. While for our MESA models, we employ 30 Myr isochrones of the nonrotating models and the models with 50% of critical linear velocities to fit the observed blue and red MSs, denoted by the solid red and the dashed blue lines, respectively. The adopted distance modulus and reddening in each fit are listed. The red shaded area depicts the projection effect (gravity darkening) on the red solid line. The small gray arrow shows how an isochrone would move if E(B − V)=0.05 is added.
Current usage metrics show cumulative count of Article Views (full-text article views including HTML views, PDF and ePub downloads, according to the available data) and Abstracts Views on Vision4Press platform.
Data correspond to usage on the plateform after 2015. The current usage metrics is available 48-96 hours after online publication and is updated daily on week days.
Initial download of the metrics may take a while.