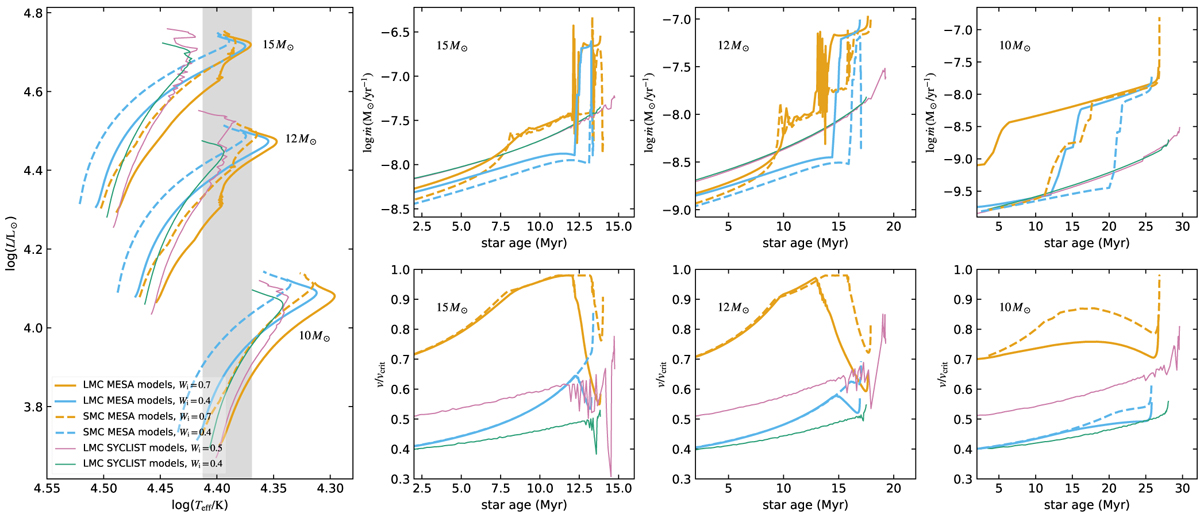
Fig. C.2.

Download original image
The left panel shows the evolutionary tracks of the rotating single-star models in different model sets in the Hertzsprung-Russell diagram. The thick orange lines correspond to our MESA models with higher initial rotational velocity, with solid and dashed lines denoting the LMC metallicity and the SMC metallicity, respectively. While the thick blue lines represent our MESA models with lower initial rotational velocity. The thin purple and green lines denote the SYCLIST models that have initial fast and slow spins, respectively. The mass of the stellar models are listed. The gray shaded area indicates the temperature region in which we consider the bi-stability jump related stellar wind for our MESA models. The other three columns of panels illustrate the evolution of mass loss rate and critical velocity (see Eq.3) fraction as a function of stellar age, for three different masses. The meaning of the lines are the same as in the left panel.
Current usage metrics show cumulative count of Article Views (full-text article views including HTML views, PDF and ePub downloads, according to the available data) and Abstracts Views on Vision4Press platform.
Data correspond to usage on the plateform after 2015. The current usage metrics is available 48-96 hours after online publication and is updated daily on week days.
Initial download of the metrics may take a while.


