Fig. 7
Download original image
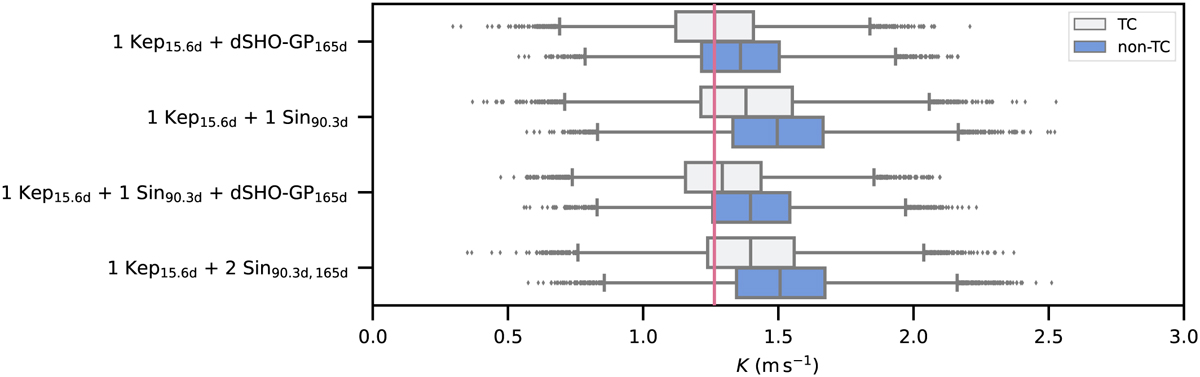
Box plot of the posteriors for the distributions of the minimum mass for the 15.6 d signal based on the model choice. The gray and blue boxes represent the 25 and 75% quartiles of the posterior from the telluric-corrected (TC) and nontelluric-corrected (nonTC) RVs, respectively. The red vertical line represents the median value of the minimum mass of the 15.6 d signal when applying the most favored model. The extending gray lines depict the rest of the distribution and the dots are deemed as “outliers”. The models named here match those in Table 4.
Current usage metrics show cumulative count of Article Views (full-text article views including HTML views, PDF and ePub downloads, according to the available data) and Abstracts Views on Vision4Press platform.
Data correspond to usage on the plateform after 2015. The current usage metrics is available 48-96 hours after online publication and is updated daily on week days.
Initial download of the metrics may take a while.