Fig. 5
Download original image
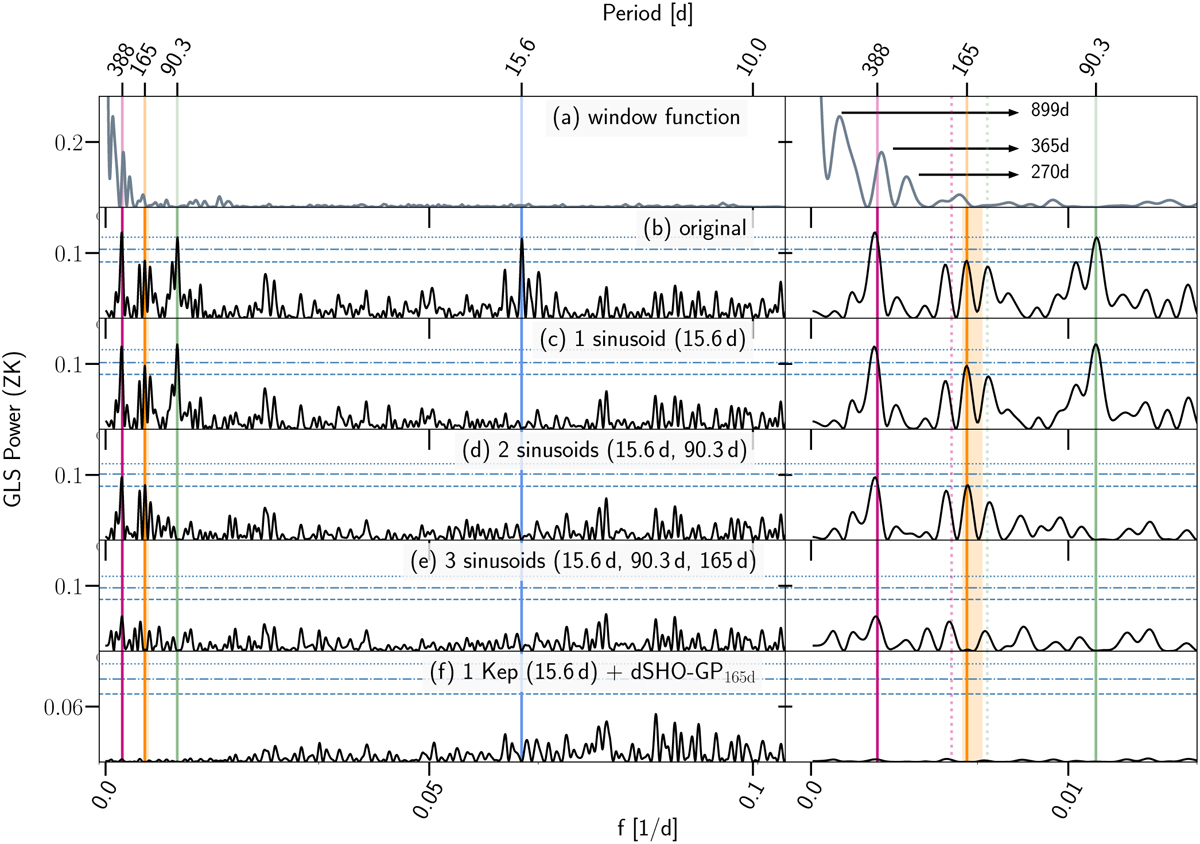
GLS periodograms for the RVs of Wolf 1069 after sequentially subtracting out the most prominent signals. The horizontal dashed, dot-dashed, and dotted lines represent the 10, 1, and 0.1% FAP levels (from bottom to top). There were no significant signals with periods shorter than 10 d other than the aliases due to the daily sampling. The right panel is a closer zoom-in of the left panel to highlight the longer-period signals. The 15.6 d planetary signal is illustrated with a vertical blue solid line, and the 90.3 d signal and its alias due to the 270-d sampling with a green solid and dashed line, respectively. The range for the photometric rotation period is shaded in orange, where the stellar rotation period within the RVs is marked with an orange solid line. The component of residual telluric contamination at 388 d and its alias due to the 365-d sampling period are also represented with a vertical magenta solid and dashed line, respectively. Panel a: the window function of the data set. Panel b: no signal fitted, solely the original RVs with an offset and jitter term. Panel c: residuals after subtracting the 15.6 d signal. Panel d: residuals after subtracting a simultaneous model fit of two sinusoids at 15.6 and 90.3 d. Panel e: residuals after subtracting a simultaneous model fit of three sinusoids at 15.6, 90.3, and 165 d. Panel f: residuals after subtracting the final model choice including 1 Keplerian at 15.6 d (further described in Sect. 4.2).
Current usage metrics show cumulative count of Article Views (full-text article views including HTML views, PDF and ePub downloads, according to the available data) and Abstracts Views on Vision4Press platform.
Data correspond to usage on the plateform after 2015. The current usage metrics is available 48-96 hours after online publication and is updated daily on week days.
Initial download of the metrics may take a while.