Fig. 3
Download original image
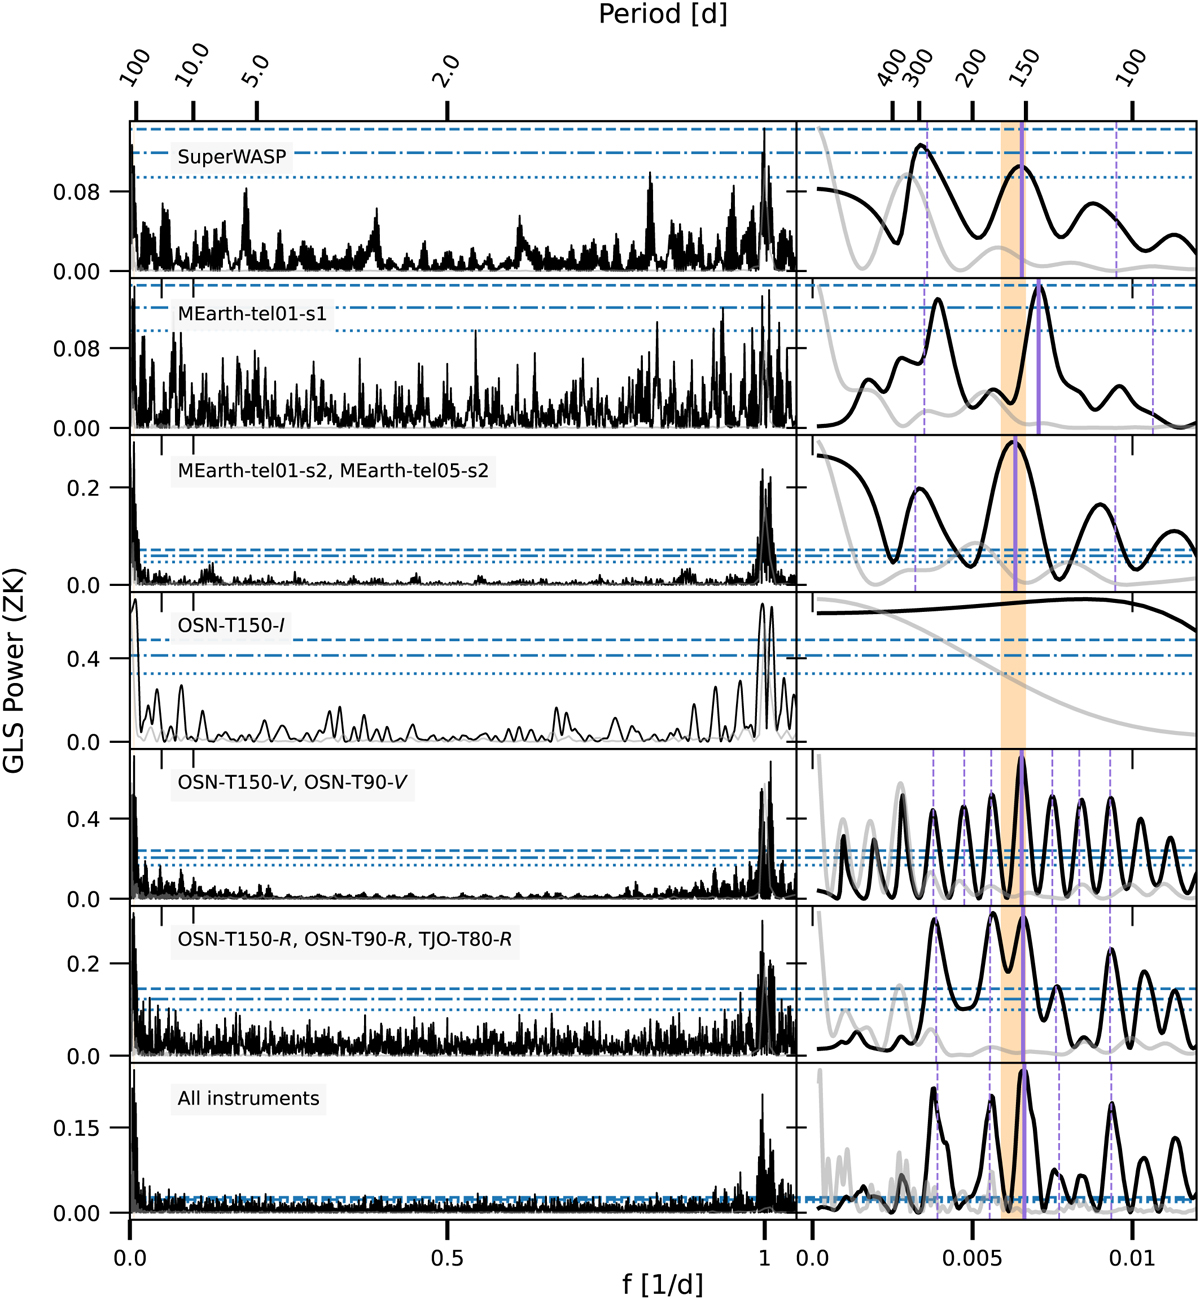
GLS periodograms for the long-term photometric data of Wolf 1069. The right panels are zoomed in to the longer-period regime. Each horizontal panel represents an effective instrument that was considered for the determination of the stellar rotation period (Sect. 3.2). The normalized GLS power of the sampling of the data for each row is shown in gray. The range for the photometric rotation period of 150–170 d is shaded in orange. Some significant alias signals due to the sampling of each respective data set are illustrated with a vertical dashed line, whereas the true signal is marked with a solid line.
Current usage metrics show cumulative count of Article Views (full-text article views including HTML views, PDF and ePub downloads, according to the available data) and Abstracts Views on Vision4Press platform.
Data correspond to usage on the plateform after 2015. The current usage metrics is available 48-96 hours after online publication and is updated daily on week days.
Initial download of the metrics may take a while.