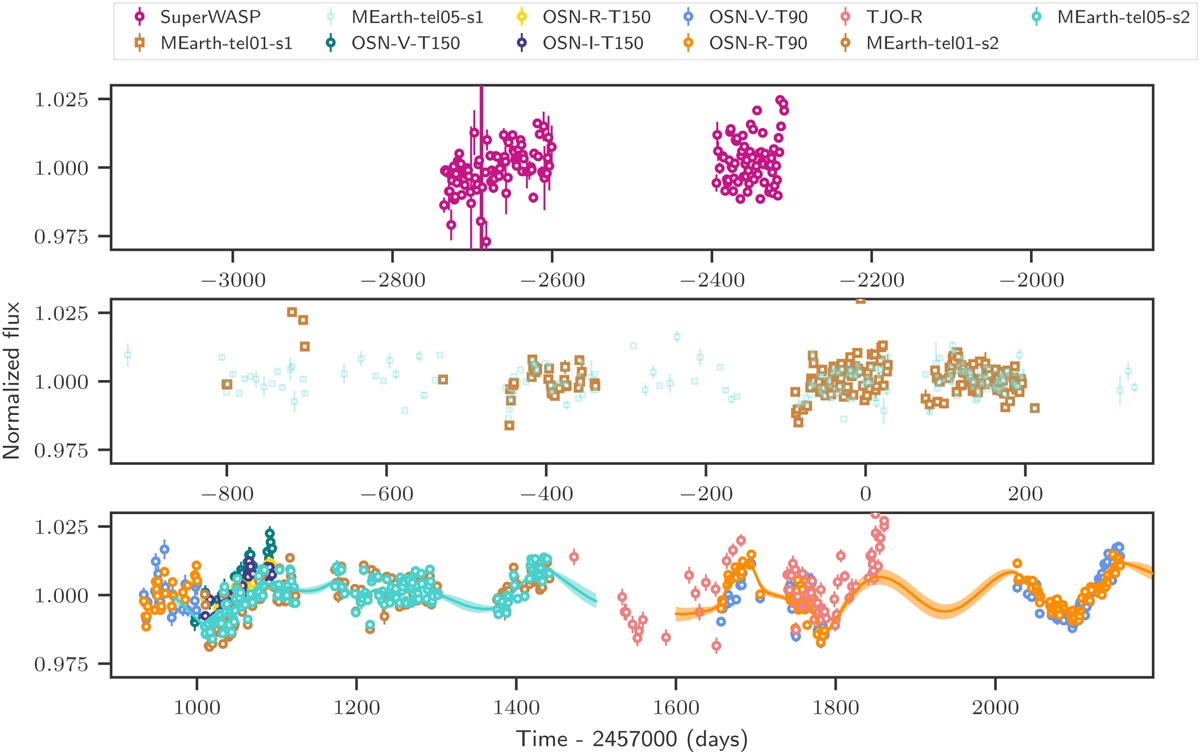
Fig. 2
Download original image
Time series of the long-term photometry for Wolf 1069 color coded by instrument and filter. The time range for each panel is consistent among all panels. The MEarth-tel05-s1 data were not included in the final rotational period determination but are faintly shown for illustrative purposes. Given that the GP model is unique to each instrument with its own amplitude hyperparamter (see for example Fig. 8 in Kemmer et al. 2020), the extrapolated GP models of two instruments (MEarth-tel-05 and OSN-R-T90) are overplotted with the same color as their respective data sets for illustrative purposes.
Current usage metrics show cumulative count of Article Views (full-text article views including HTML views, PDF and ePub downloads, according to the available data) and Abstracts Views on Vision4Press platform.
Data correspond to usage on the plateform after 2015. The current usage metrics is available 48-96 hours after online publication and is updated daily on week days.
Initial download of the metrics may take a while.