Fig. 1
Download original image
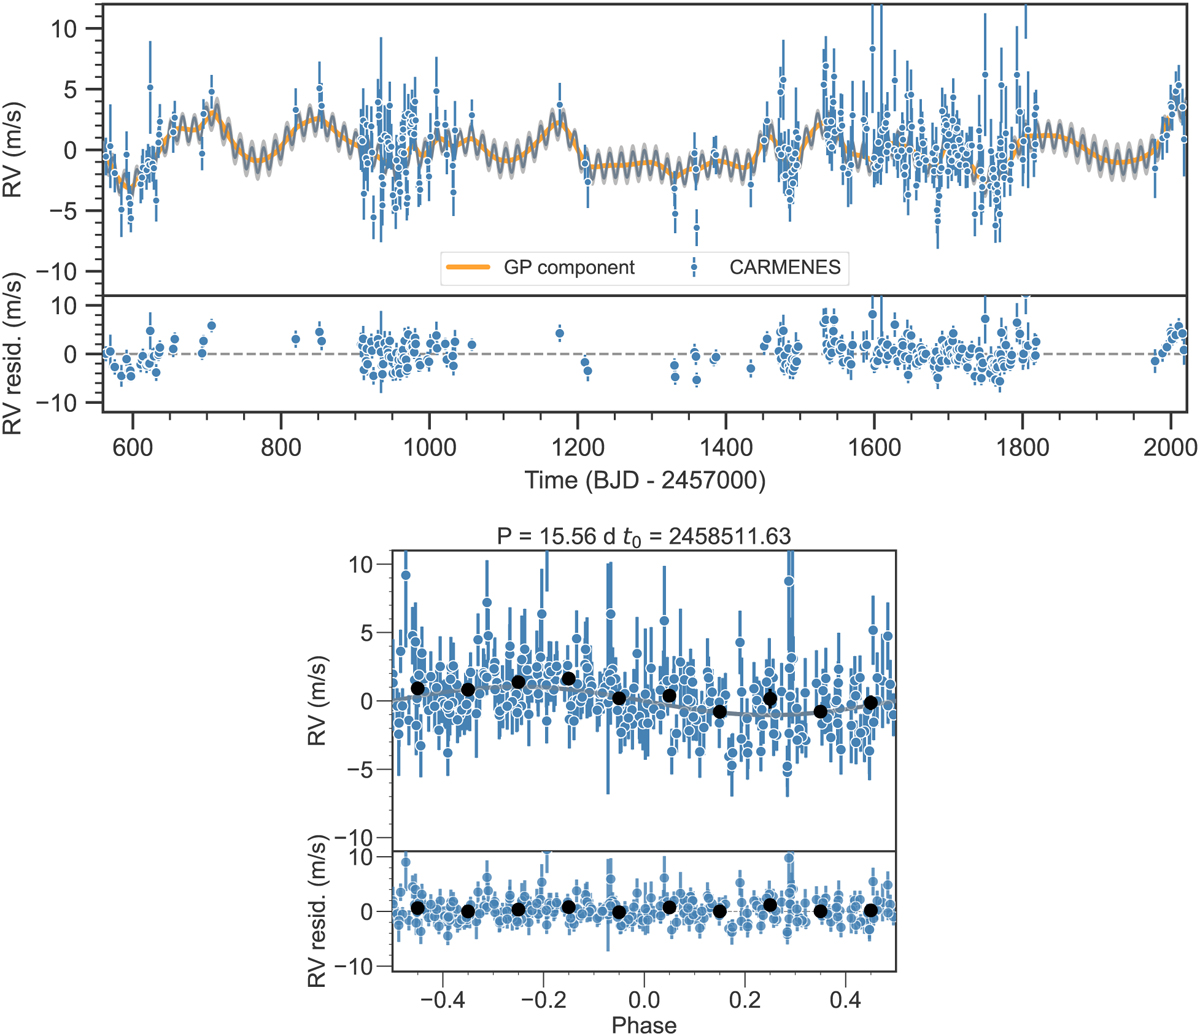
RV time series and phase-folded plots for Wolf 1069 b. Top panel: CARMENES VIS RV measurements for Wolf 1069 along with the best-fit model (dark gray line) and the stellar rotation period modeled by a dSHO-GP (orange). The light gray band indicates the 68% confidence interval of the model. Bottom panel: RVs phase-folded to the period of Wolf 1069 b at 15.6 d (Kb = 1.07 ± 0.17 m s−1) and with the GP component subtracted out. The black circles represent the data points binned to 0.1 in phase space for visualization purposes. The bottom panel for each plot represents the residuals after subtracting out the model. There are two data points that did not fit within the boundary for visual reasons.
Current usage metrics show cumulative count of Article Views (full-text article views including HTML views, PDF and ePub downloads, according to the available data) and Abstracts Views on Vision4Press platform.
Data correspond to usage on the plateform after 2015. The current usage metrics is available 48-96 hours after online publication and is updated daily on week days.
Initial download of the metrics may take a while.