Fig. 7
Download original image
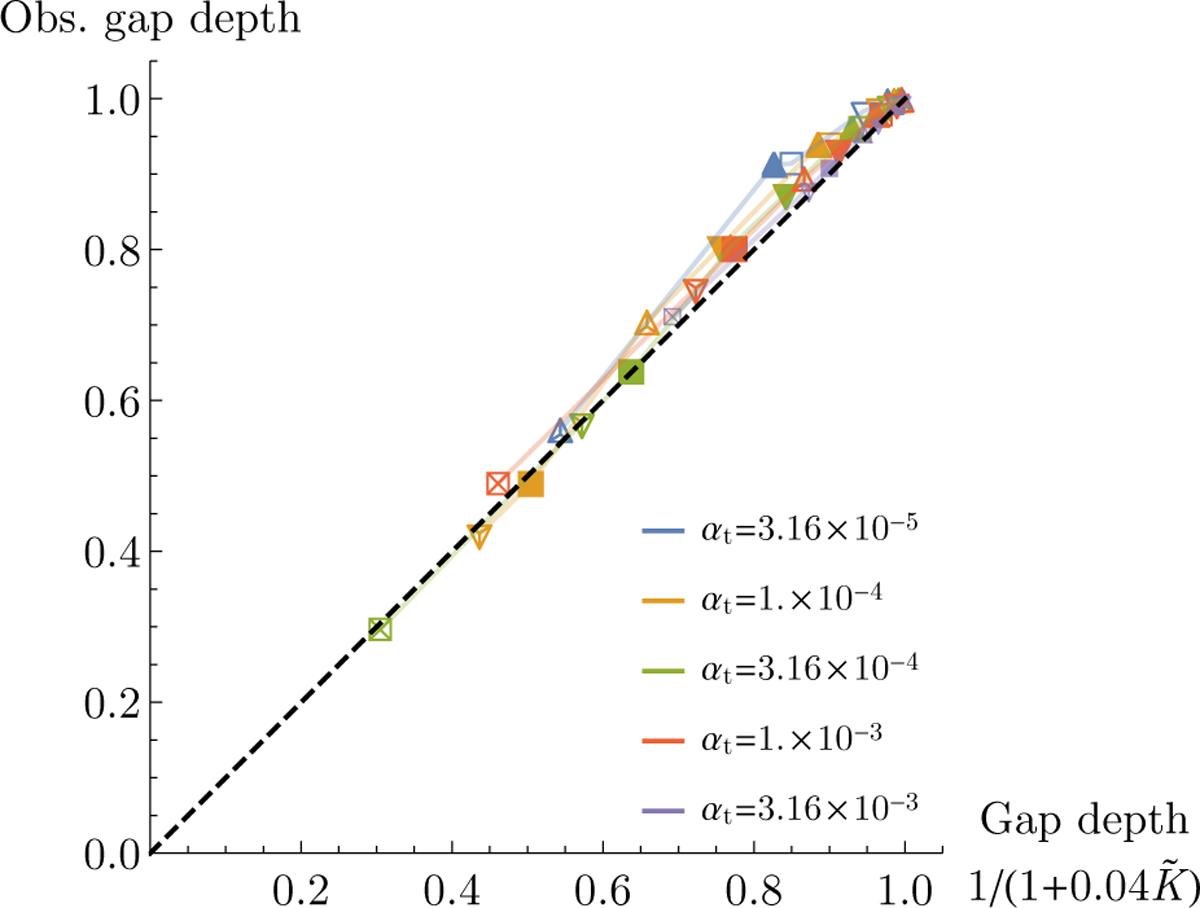
Similar to Fig. 2, but using Eq. (31) as an approximation for the gap depth, showing better agreement with the data. As in Fig. 2, different colours represent different levels of viscosity as shown in the legend, and different symbols represent different aspect ratios and planetary masses: squares, downward-pointing triangles, and upward-pointing triangles for h = 0.04, 0.05, and 0.06 respectively; empty, filled, and crossed symbols for mpl/M* = 10−5, 3 × 10⁻⁵, and 6 × 10⁻⁵, respectively.
Current usage metrics show cumulative count of Article Views (full-text article views including HTML views, PDF and ePub downloads, according to the available data) and Abstracts Views on Vision4Press platform.
Data correspond to usage on the plateform after 2015. The current usage metrics is available 48-96 hours after online publication and is updated daily on week days.
Initial download of the metrics may take a while.