Fig. 6
Download original image
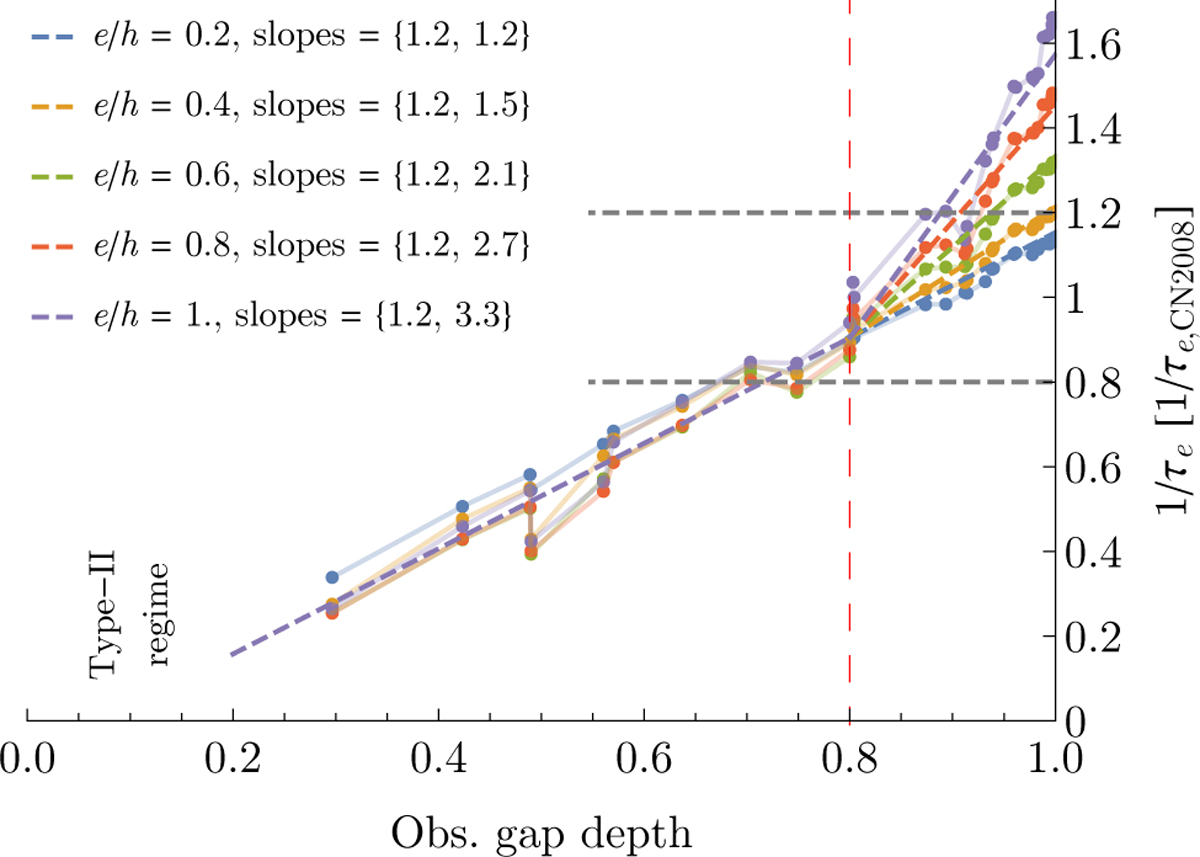
Double linear fit of e-damping efficiency to the data from panel b of Fig. 5 according to Eq. (28). The fit to the data is split into a linear fit over gap depths ∈ [0.3, 0.8], and a separate linear fit over gap depths ∈ [0.8,1], which continuously joins with the previous fit. The slopes for both fits are given in the legend in the top left corner.
Current usage metrics show cumulative count of Article Views (full-text article views including HTML views, PDF and ePub downloads, according to the available data) and Abstracts Views on Vision4Press platform.
Data correspond to usage on the plateform after 2015. The current usage metrics is available 48-96 hours after online publication and is updated daily on week days.
Initial download of the metrics may take a while.