Fig. 5
Download original image
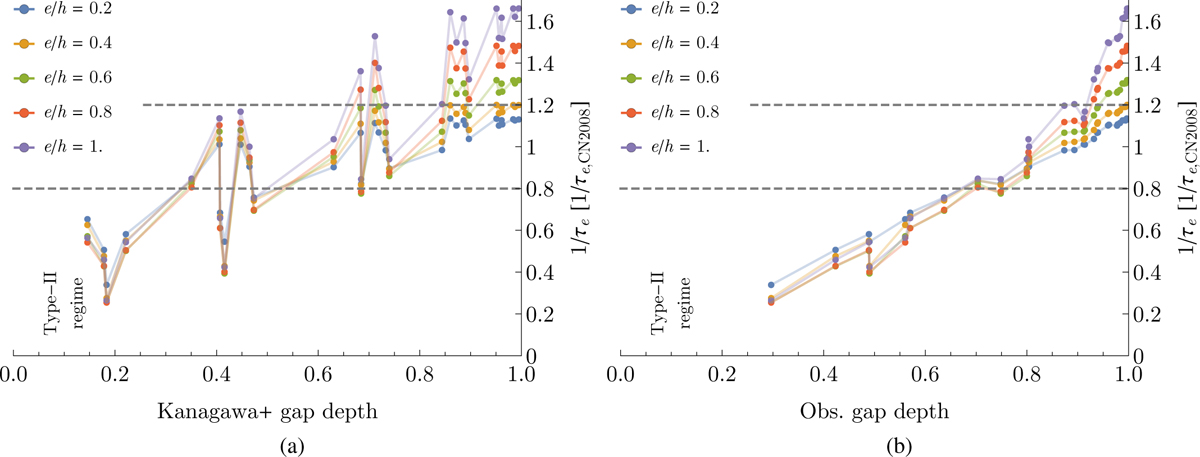
Eccentricity damping efficiency versus gap-depth for all setups where no vortex emerged. In both panels, the e-damping efficiency on the vertical axis is normalised by the expected value from Cresswell & Nelson (2008). A 20% error around the expected value in the limit of no gap (to the right in the plots) is shown by two dashed horizontal grey lines. Values for the e-damping efficiency are shown for different eccentricities, e/h ∈ {0.2, 0.4, 0.6, 0.8, 1), by points of different colours joined together by opaque lines. Panel a shows on the horizontal axis the gap depth according to the prediction of Kanagawa et al. (2018), which results in an extremely noisy scatter plot. Panel b shows, on the horizontal axis, the gap depth observed from the actual simulations as plotted in Fig. 2, which shows a much cleaner dependence. In both panels, the overall trend clearly shows a decrease in e-damping efficiency (i.e. longer e-damping timescales) for deeper and deeper gaps, down to a factor of ~l/4 less efficient eccentricity damping at the transition from type-I to type-II regimes (gap depths of ≃0.25) as compared to the limit of no gap.
Current usage metrics show cumulative count of Article Views (full-text article views including HTML views, PDF and ePub downloads, according to the available data) and Abstracts Views on Vision4Press platform.
Data correspond to usage on the plateform after 2015. The current usage metrics is available 48-96 hours after online publication and is updated daily on week days.
Initial download of the metrics may take a while.