Fig. 4
Download original image
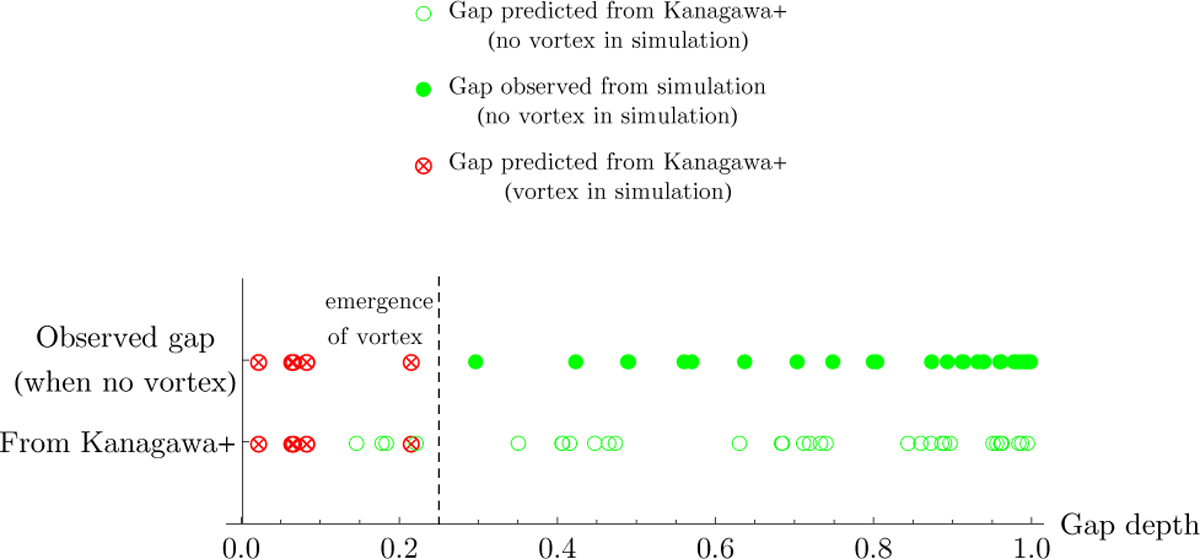
Emergence of vortices in our simulations as a function of the gap depth. When no vortex was observed, we report both the observed gap depth at the end of our simulations, as well as the predicted one from Kanagawa et al. (2018), with a green circle (filled and unfilled, respectively). A red ⊗ symbolises those simulations where a vortex appeared, in which case only the predicted value from Kanagawa et al. (2018) is plotted. A dashed vertical line marks the approximate location of the transition between no vortex and vortex.
Current usage metrics show cumulative count of Article Views (full-text article views including HTML views, PDF and ePub downloads, according to the available data) and Abstracts Views on Vision4Press platform.
Data correspond to usage on the plateform after 2015. The current usage metrics is available 48-96 hours after online publication and is updated daily on week days.
Initial download of the metrics may take a while.