Fig. 2
Download original image
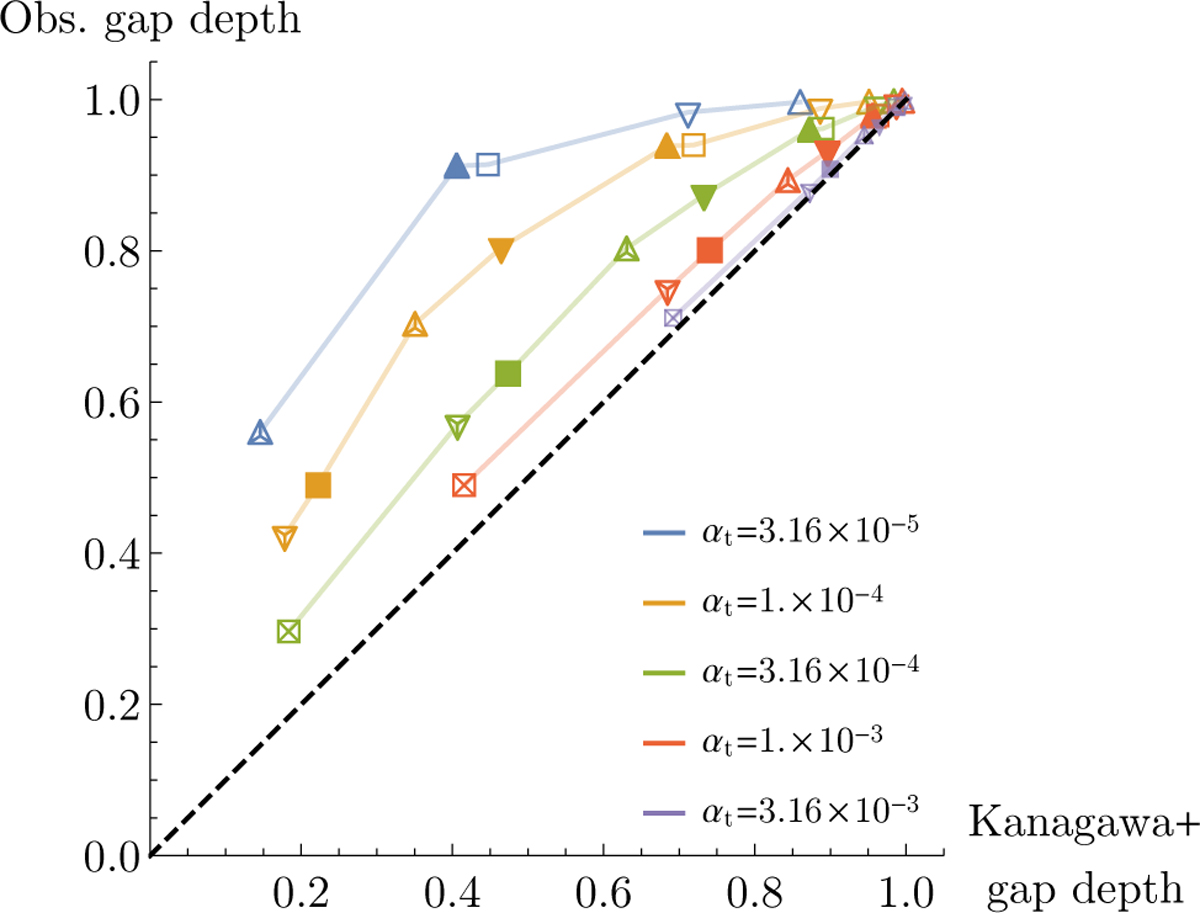
Predicted gap depth, Σmin/Σ0, from Kanagawa et al. (2018) versus value obtained from the simulations. Different colours represent different levels of viscosity as shown in the legend. The lower the viscosity, the bigger the difference in gap depth. However, down to the viscosities considered by Kanagawa et al. (2018), we see good agreement, as expected (the data for αt = 3.16 × 10⁻³ are shown with smaller symbols as they are only used for the analysis of the gap depth). Different shapes are used to represent different aspect ratios and planetary masses; squares, downward-pointing triangles, and upward-pointing triangles represent aspect ratios of 0.04, 0.05, and 0.06, respectively; empty, filled and crossed symbols represent mpl/M* = 10−5, 3 × 10⁻⁵, and 6 × 10⁻⁵, respectively.
Current usage metrics show cumulative count of Article Views (full-text article views including HTML views, PDF and ePub downloads, according to the available data) and Abstracts Views on Vision4Press platform.
Data correspond to usage on the plateform after 2015. The current usage metrics is available 48-96 hours after online publication and is updated daily on week days.
Initial download of the metrics may take a while.