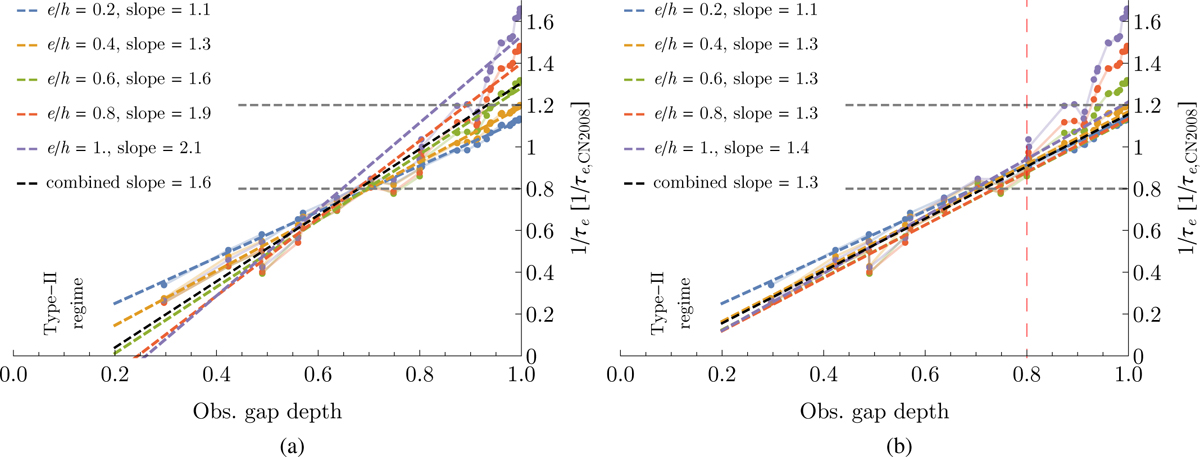
Fig. A.3
Download original image
Linear fit of the e-damping efficiency to the data from panel b of Figure 5, that is, using the gap depths observed from the simulations on the horizontal axis. In panel a we fit the full data, both for the separate values of e/h (coloured dashed lines) and for the full data set combining all eccentricities (black dashed line). In panel b we fit the data in the same way, but considering gap depths of up to 80% (indicated by the dashed red vertical line). In both cases we report the observed slopes of the lines in the top left legend.
Current usage metrics show cumulative count of Article Views (full-text article views including HTML views, PDF and ePub downloads, according to the available data) and Abstracts Views on Vision4Press platform.
Data correspond to usage on the plateform after 2015. The current usage metrics is available 48-96 hours after online publication and is updated daily on week days.
Initial download of the metrics may take a while.