Open Access
Fig. A.2
Download original image
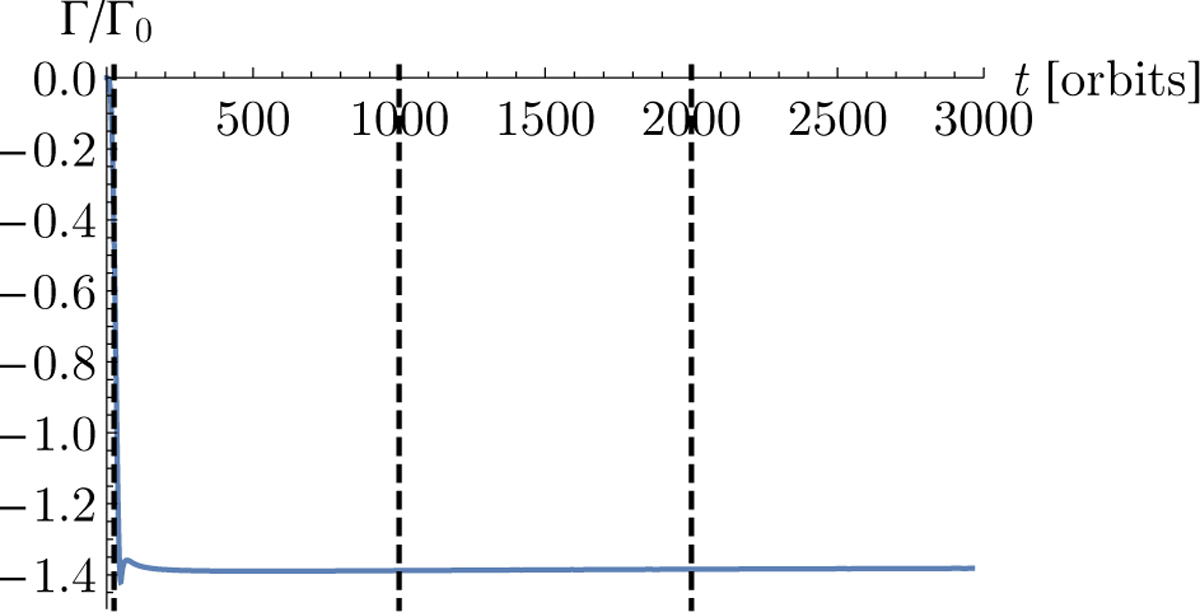
Evolution of the torque felt by the planet in the setup presented in Figure A.1 as a function of time. The vertical dashed line represents timestamps for which the surface density is shown in Figure A.1. The torque stabilises quickly in this case, as the system reaches a long-lived steady state.
Current usage metrics show cumulative count of Article Views (full-text article views including HTML views, PDF and ePub downloads, according to the available data) and Abstracts Views on Vision4Press platform.
Data correspond to usage on the plateform after 2015. The current usage metrics is available 48-96 hours after online publication and is updated daily on week days.
Initial download of the metrics may take a while.