Fig. 5
Download original image
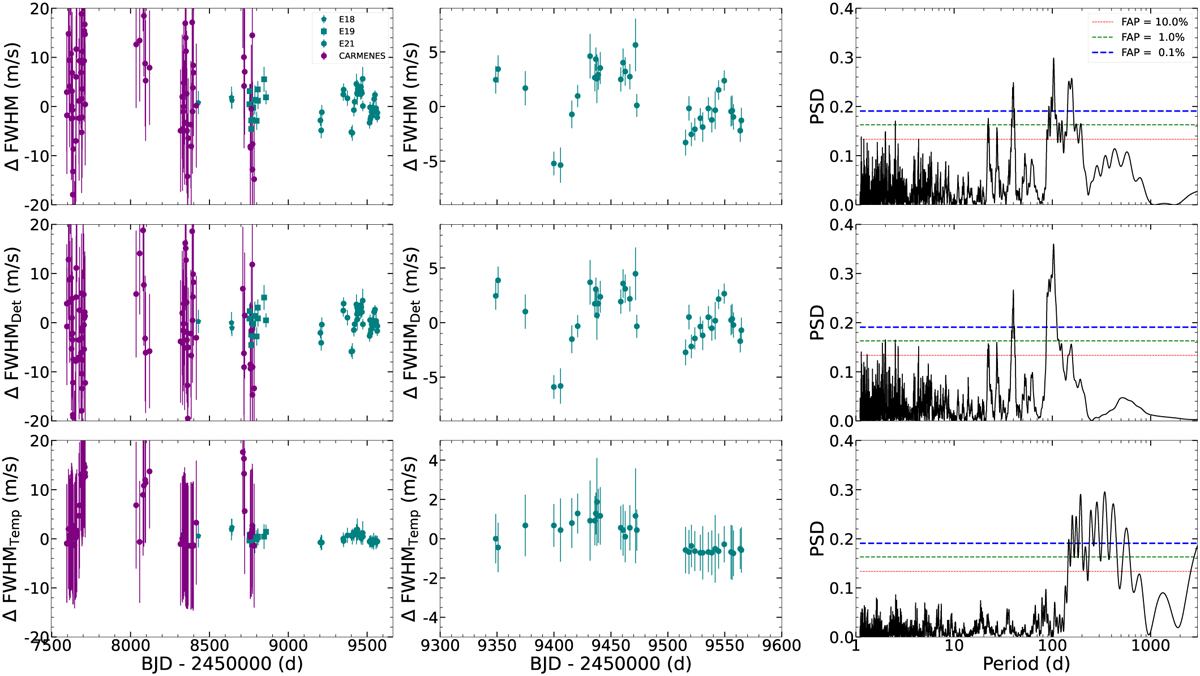
Effect of the changes of the temperature of the Échelle grating in the FWHM. Top panels: combined FWHM time series of ESPRESSO and CARMENES, a zoom into the latest ESPRESSO campaign and the periodogram of the data. Middle panels: same plot for the combined FWHM time series of ESPRESSO and CARMENES after detrending with respect to the temperature variations of the Échelle grating. Bottom panels: same plot for the estimated effect in FWHM due to temperature changes.
Current usage metrics show cumulative count of Article Views (full-text article views including HTML views, PDF and ePub downloads, according to the available data) and Abstracts Views on Vision4Press platform.
Data correspond to usage on the plateform after 2015. The current usage metrics is available 48-96 hours after online publication and is updated daily on week days.
Initial download of the metrics may take a while.