Fig. 2
Download original image
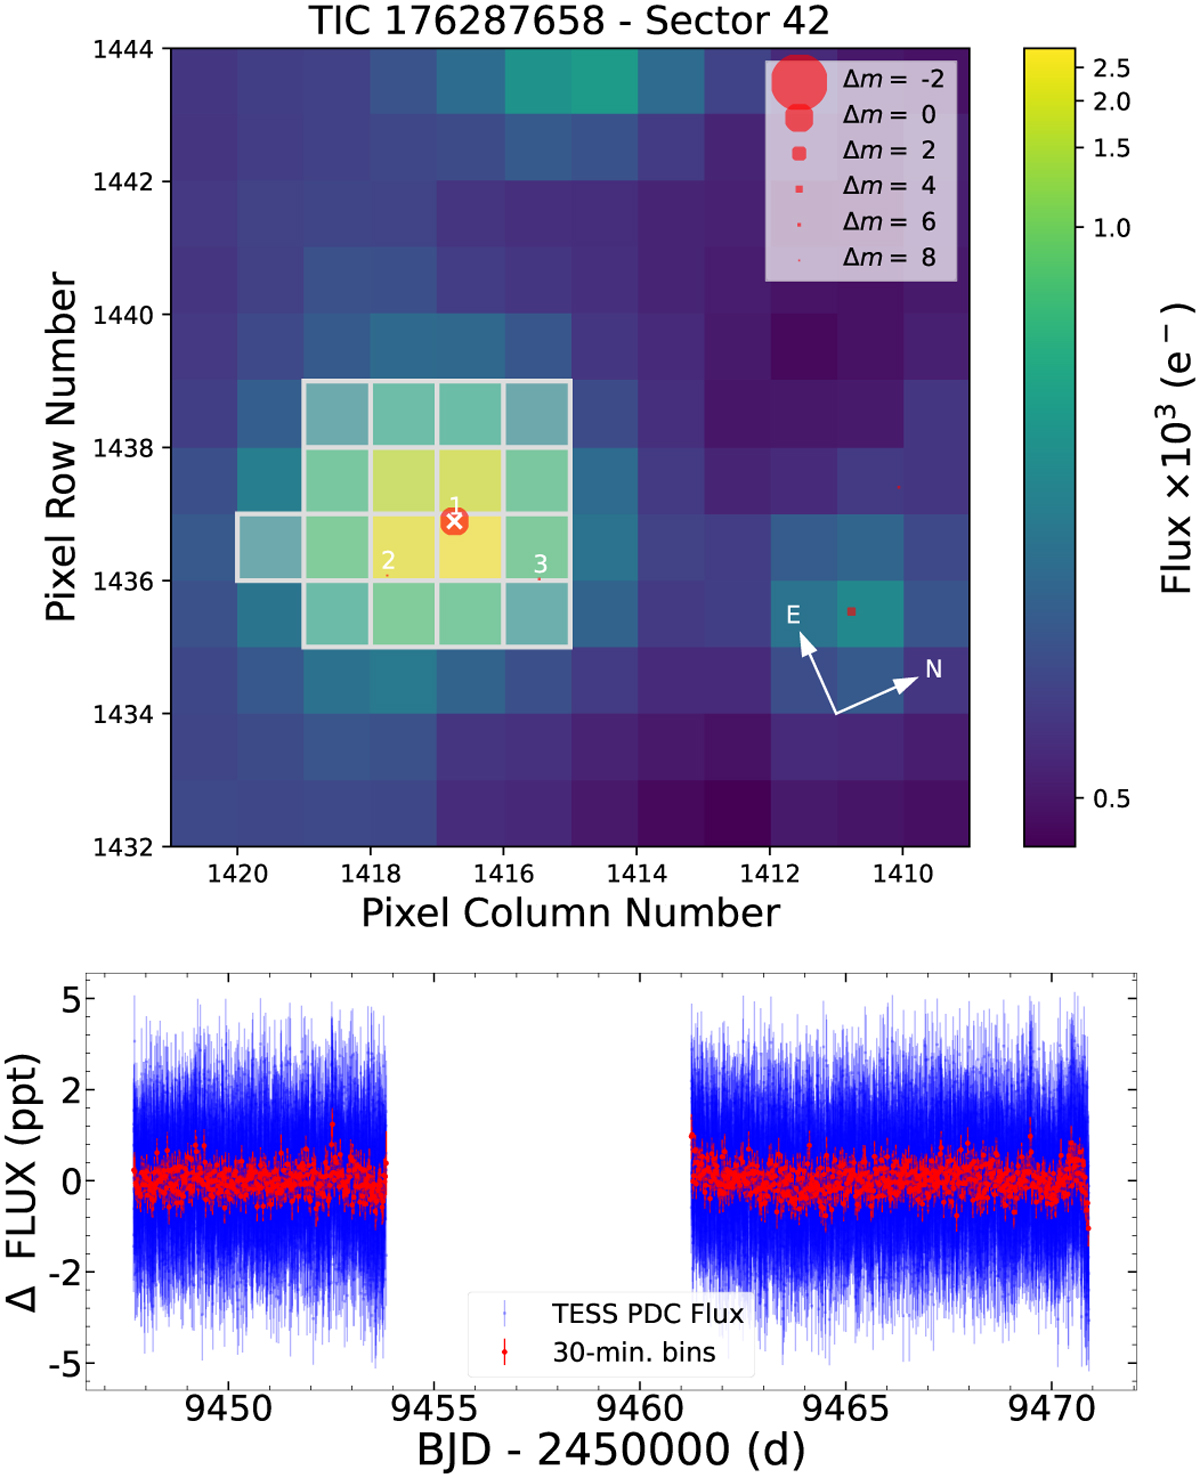
TESS data. Top panel: TPF file of GJ1002 (cross symbol) for TESS sector 42. The electron counts are colour-coded. The TESS optimal photometric aperture used to obtain the SAP fluxes is marked with white squares. The Gaia DR2 objects with G-band magnitudes down to 8 mag fainter than GJ1002 are labelled with numbers, and their scaled brightness, based on Gaia magnitudes, is shown by red circles of different sizes (see figure inset). The pixel scale is 21 arcsecpixel−1. Bottom panel: TESS light curve. Blue symbols show the 2-min cadence data. The red symbols represent 30-min bins.
Current usage metrics show cumulative count of Article Views (full-text article views including HTML views, PDF and ePub downloads, according to the available data) and Abstracts Views on Vision4Press platform.
Data correspond to usage on the plateform after 2015. The current usage metrics is available 48-96 hours after online publication and is updated daily on week days.
Initial download of the metrics may take a while.