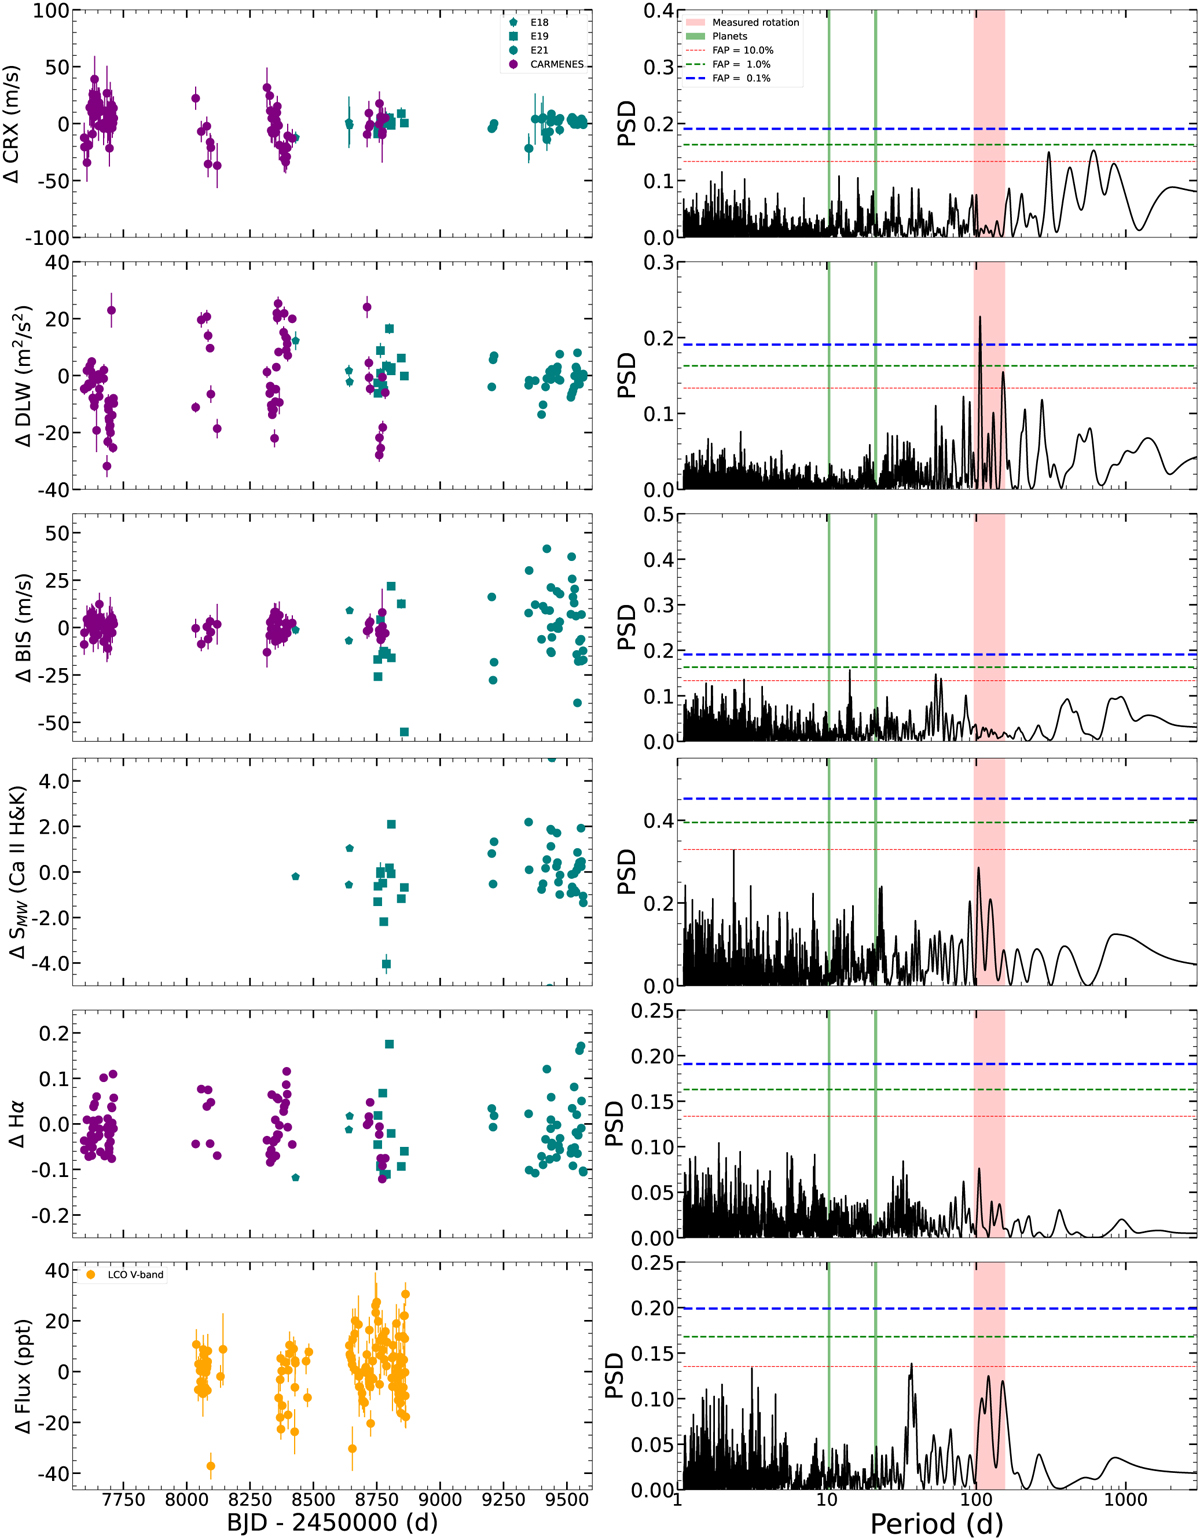
Fig. A.1

Download original image
Activity indicators (left panels) and their GLS periodograms (right panels). All spectroscopic indictors have been detrended against the temperature of the Échelle grating. The green shaded regions in the GLS periodograms show the periods of the planets GJ 1002 b and c. The widths of the region around the periods have been exaggerated for better visualisation. The red shaded regions shows the 95% confidence interval around the measured rotation period. In all cases, the median value of each dataset has been subtracted.
Current usage metrics show cumulative count of Article Views (full-text article views including HTML views, PDF and ePub downloads, according to the available data) and Abstracts Views on Vision4Press platform.
Data correspond to usage on the plateform after 2015. The current usage metrics is available 48-96 hours after online publication and is updated daily on week days.
Initial download of the metrics may take a while.


