Open Access
Fig. 14
Download original image
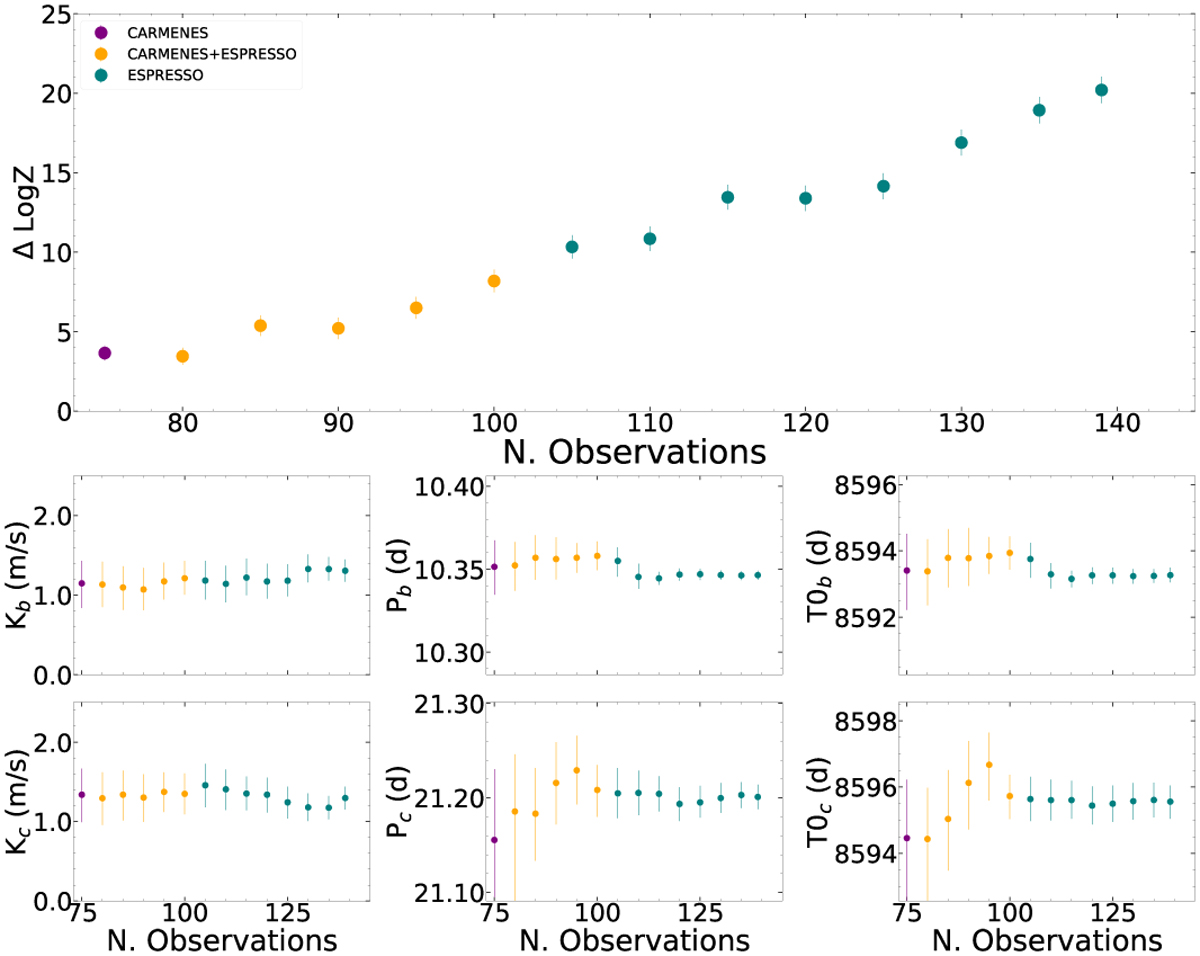
Signal stability test. Top panel: evolution of the difference in Bayesian evidence (Δ lnZ) of the 2-planet model against an activity-only model. Bottom panels: evolution of the parameters of the two sinusoids. The colours of the points show which data are added at each step.
Current usage metrics show cumulative count of Article Views (full-text article views including HTML views, PDF and ePub downloads, according to the available data) and Abstracts Views on Vision4Press platform.
Data correspond to usage on the plateform after 2015. The current usage metrics is available 48-96 hours after online publication and is updated daily on week days.
Initial download of the metrics may take a while.