Fig. 3
Download original image
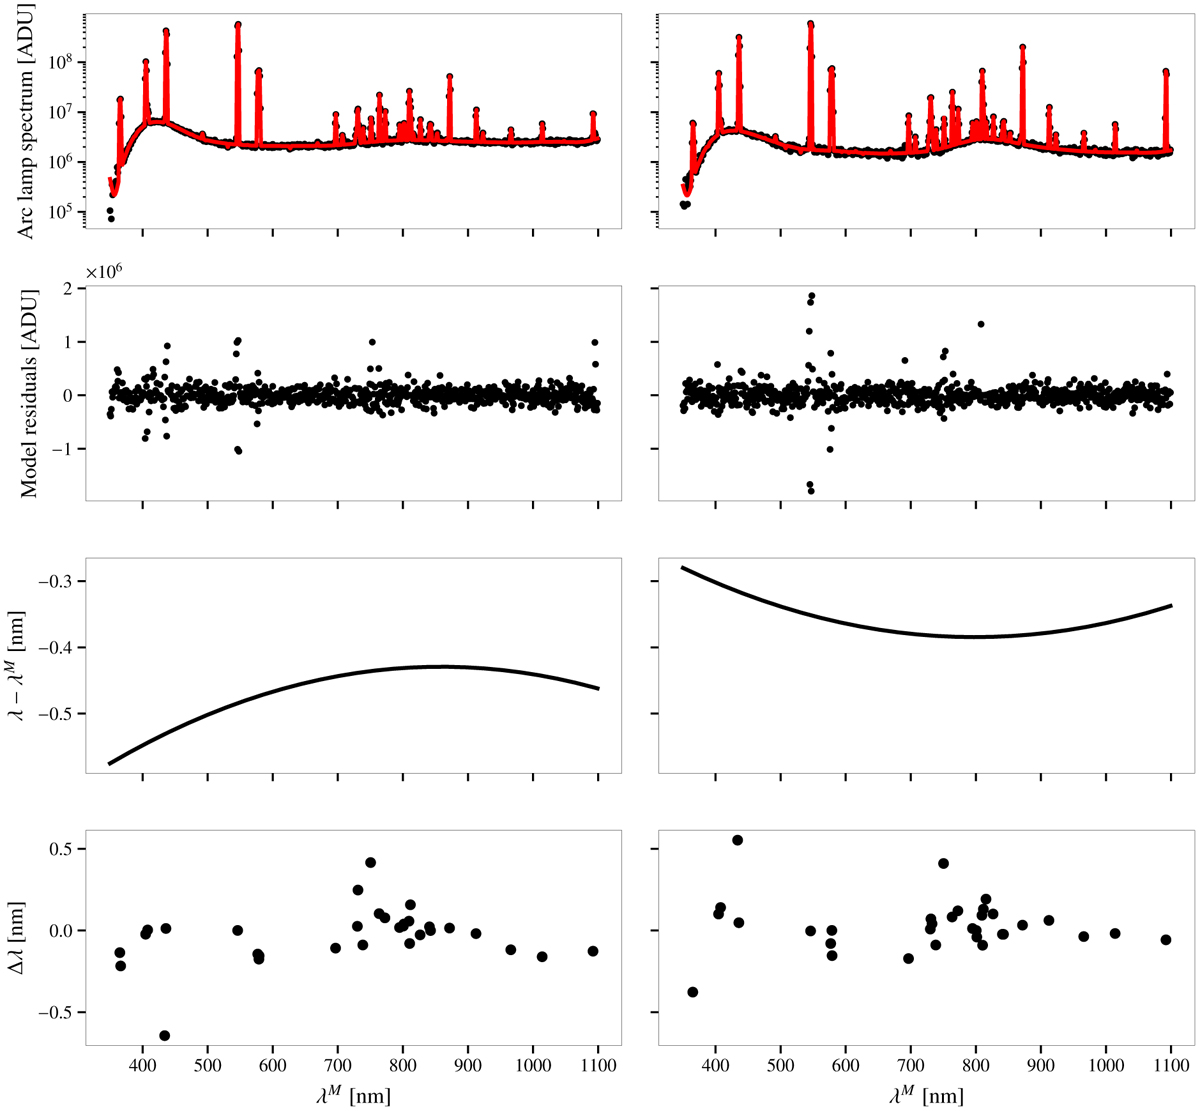
Wavelength calibration model for monochromatic calibration beam. Results for the blue-optimized grating in use for wavelengths shorter than 650 nm are presented in the left column, and results for the infrared-optimized grating are presented in the right column. Top row: observed spectrum of the Hg–Ar arc lamp (black dots) and best-fit model (red curve). Second row: Difference in the observed spectrum and the best-fit model. Third row: wavelength-calibration component of the best-fit model, that is, the quantity to be added to the monochromator set wavelength (λΜ) to match the theoretical wavelength of the observed lines (λ). Last row: residuals to the wavelength calibration, that is, the difference in measured and theoretical line wavelength in the air remaining after wavelength calibration for the brightest lines in the lamp spectrum. The RMS in the difference is, respectively, 0.17 nm and 0.16 nm for the blue and red gratings.
Current usage metrics show cumulative count of Article Views (full-text article views including HTML views, PDF and ePub downloads, according to the available data) and Abstracts Views on Vision4Press platform.
Data correspond to usage on the plateform after 2015. The current usage metrics is available 48-96 hours after online publication and is updated daily on week days.
Initial download of the metrics may take a while.