Fig. 17
Download original image
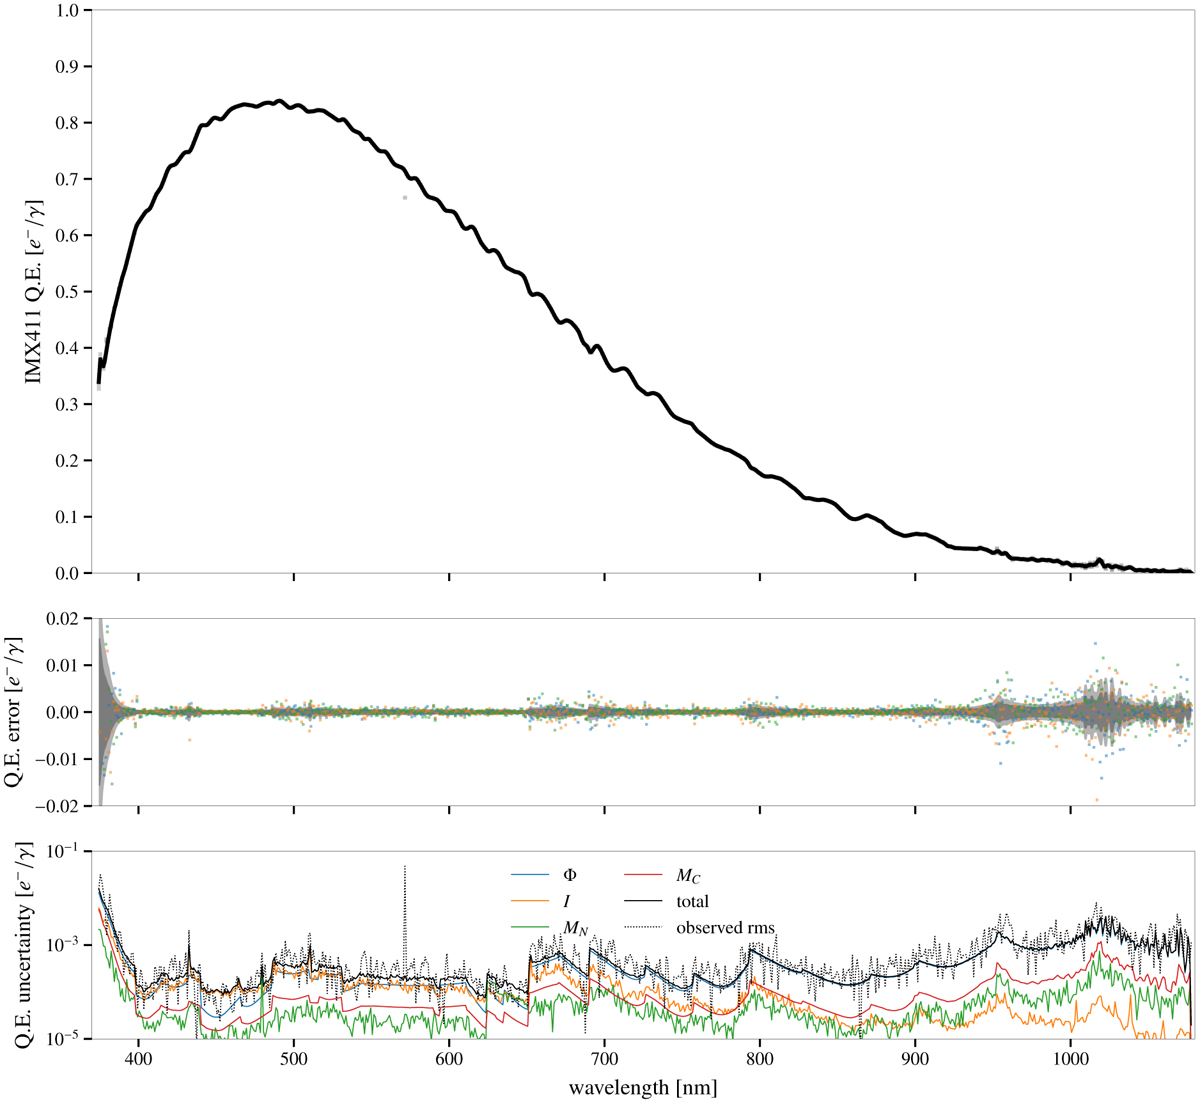
Quantum-efficiency curve of the QHY411M camera (window included). Top: three independent measurements at the same location are superimposed. The solid black line corresponds to a smooth B-spline fit to the data. Middle: residuals to the B-spline fit. The three colors correspond to the three independent measurements. Bottom: breakout of the noise in the quantum-efficiency measurement according to the origin of the contribution from the four different terms in Eq. (4). The plot also presents the quadratic sum of the four contributions (solid black line) and the RMS of the three independent measurements recalled from the middle panel (dotted black line).
Current usage metrics show cumulative count of Article Views (full-text article views including HTML views, PDF and ePub downloads, according to the available data) and Abstracts Views on Vision4Press platform.
Data correspond to usage on the plateform after 2015. The current usage metrics is available 48-96 hours after online publication and is updated daily on week days.
Initial download of the metrics may take a while.