Fig. 15
Download original image
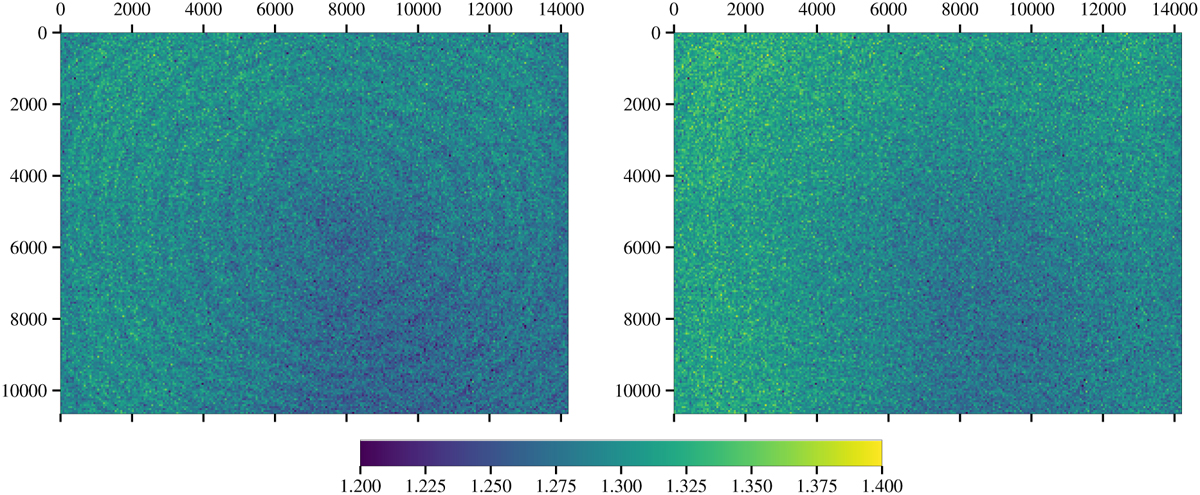
Map of the individual pixel gain obtained from 12 000 images at four different illumination levels. Left: raw gain map. The circular features arise from a periodic differential nonlinearity imprinted on the gain estimate due to a center-to-edge gradient in the illumination pattern. Right: gain map after correction of the measured empirical variance for the prediction of the nonlinearity model adjusted in Fig. 11.
Current usage metrics show cumulative count of Article Views (full-text article views including HTML views, PDF and ePub downloads, according to the available data) and Abstracts Views on Vision4Press platform.
Data correspond to usage on the plateform after 2015. The current usage metrics is available 48-96 hours after online publication and is updated daily on week days.
Initial download of the metrics may take a while.