Fig. 14
Download original image
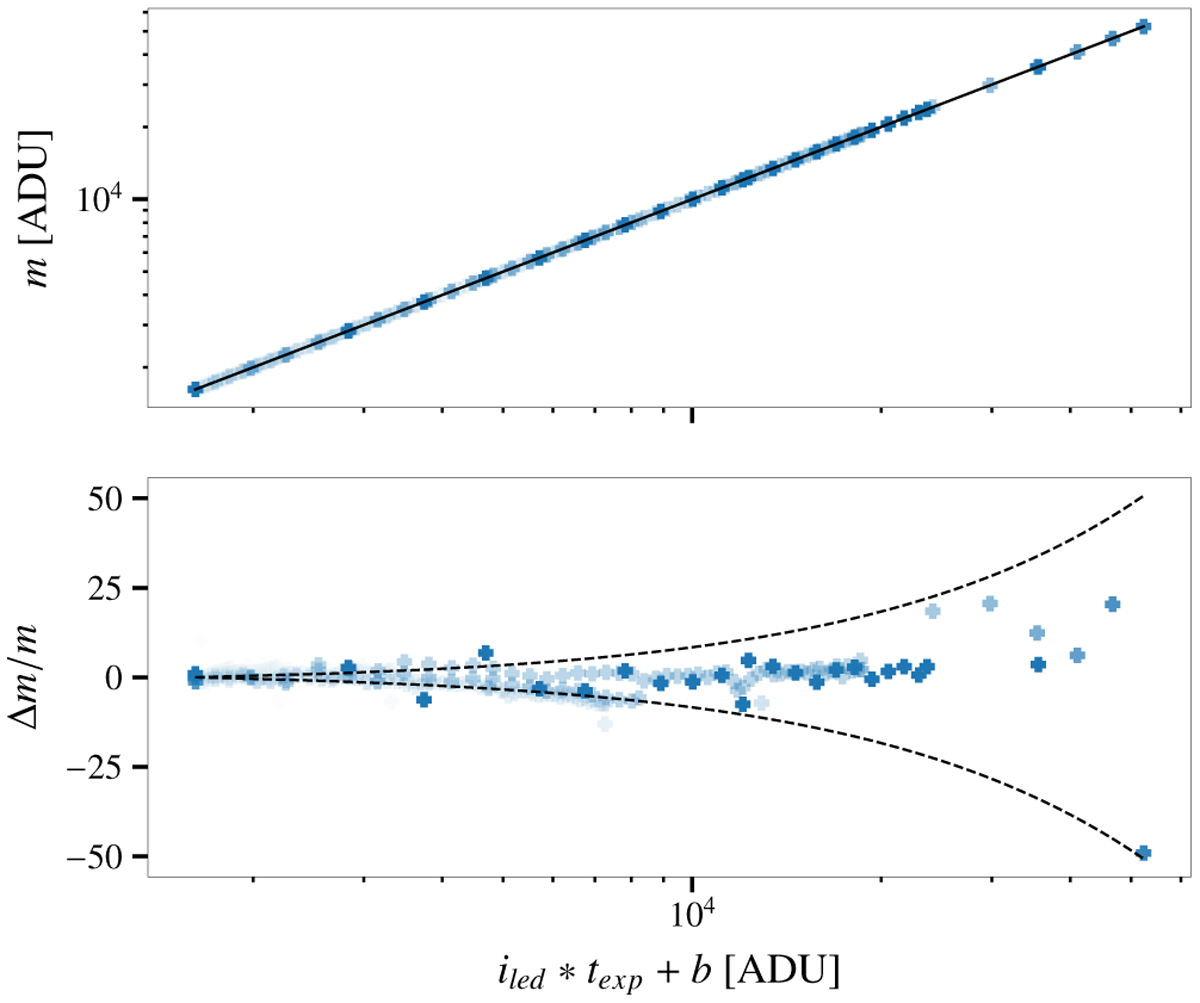
Direct linearity check performed by interlacing measurements at increasing exposure time and increasing brightness. Dot intensity encodes the exposure time. Top: average illumination level in the camera as a function of the modeled illumination intensity in the flat-field source. Bottom: difference between measured camera level and the modeled flat-field source intensity. The dashed black lines show variation of the integral gain by ±0.1%.
Current usage metrics show cumulative count of Article Views (full-text article views including HTML views, PDF and ePub downloads, according to the available data) and Abstracts Views on Vision4Press platform.
Data correspond to usage on the plateform after 2015. The current usage metrics is available 48-96 hours after online publication and is updated daily on week days.
Initial download of the metrics may take a while.