Fig. 13
Download original image
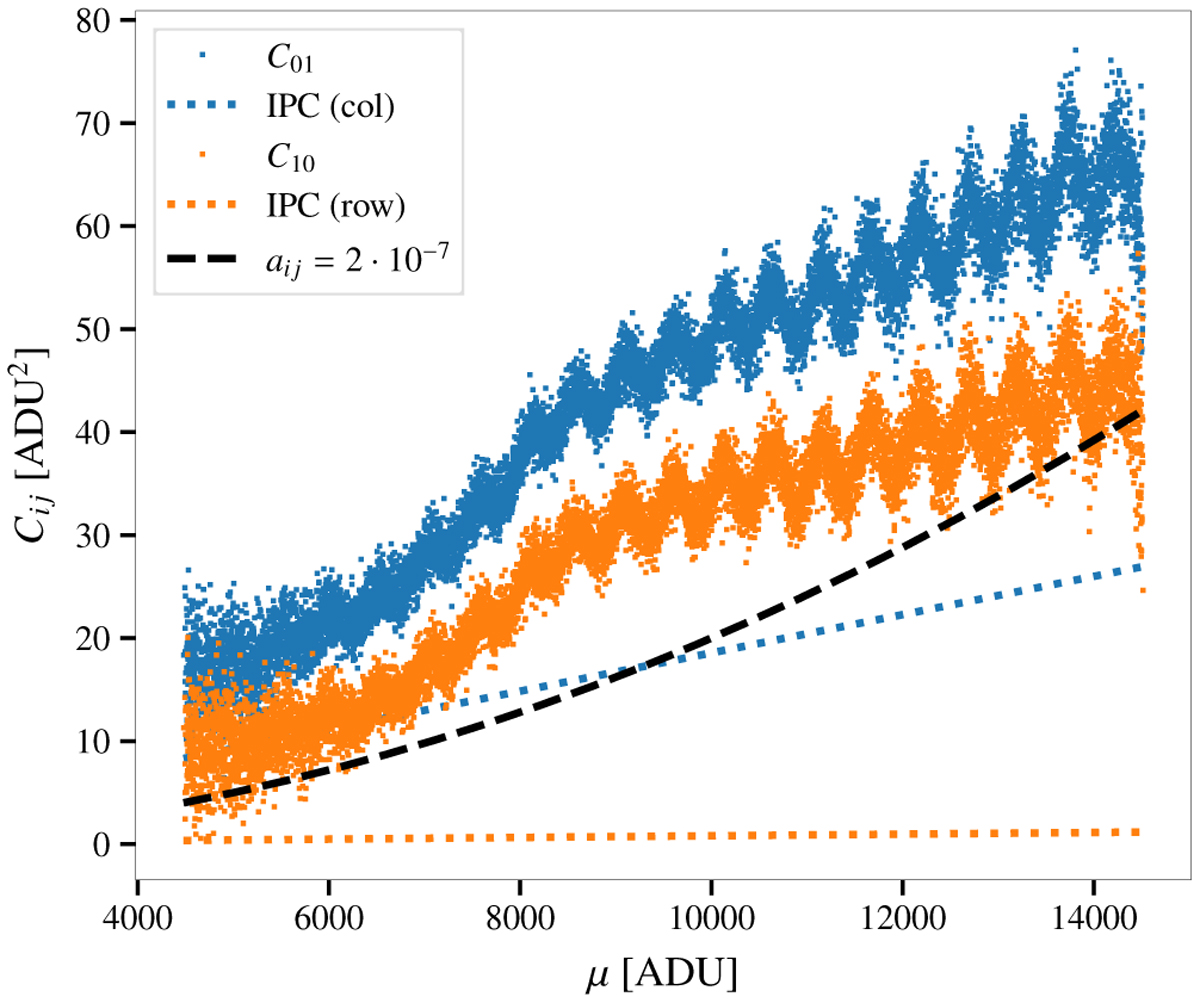
Measured covariances between the nearest neighbors in a line (C01) and in a column (C10) as a function of pixel readout. The dashed lines show the corresponding expected covariances from the measured IPC. The black dashed line shows the first-order shape of the correlation expected for an amplitude of the correlation factor corresponding to ![]() with a00 being the best-fit value from the PTC.
with a00 being the best-fit value from the PTC.
Current usage metrics show cumulative count of Article Views (full-text article views including HTML views, PDF and ePub downloads, according to the available data) and Abstracts Views on Vision4Press platform.
Data correspond to usage on the plateform after 2015. The current usage metrics is available 48-96 hours after online publication and is updated daily on week days.
Initial download of the metrics may take a while.