Fig. 12
Download original image
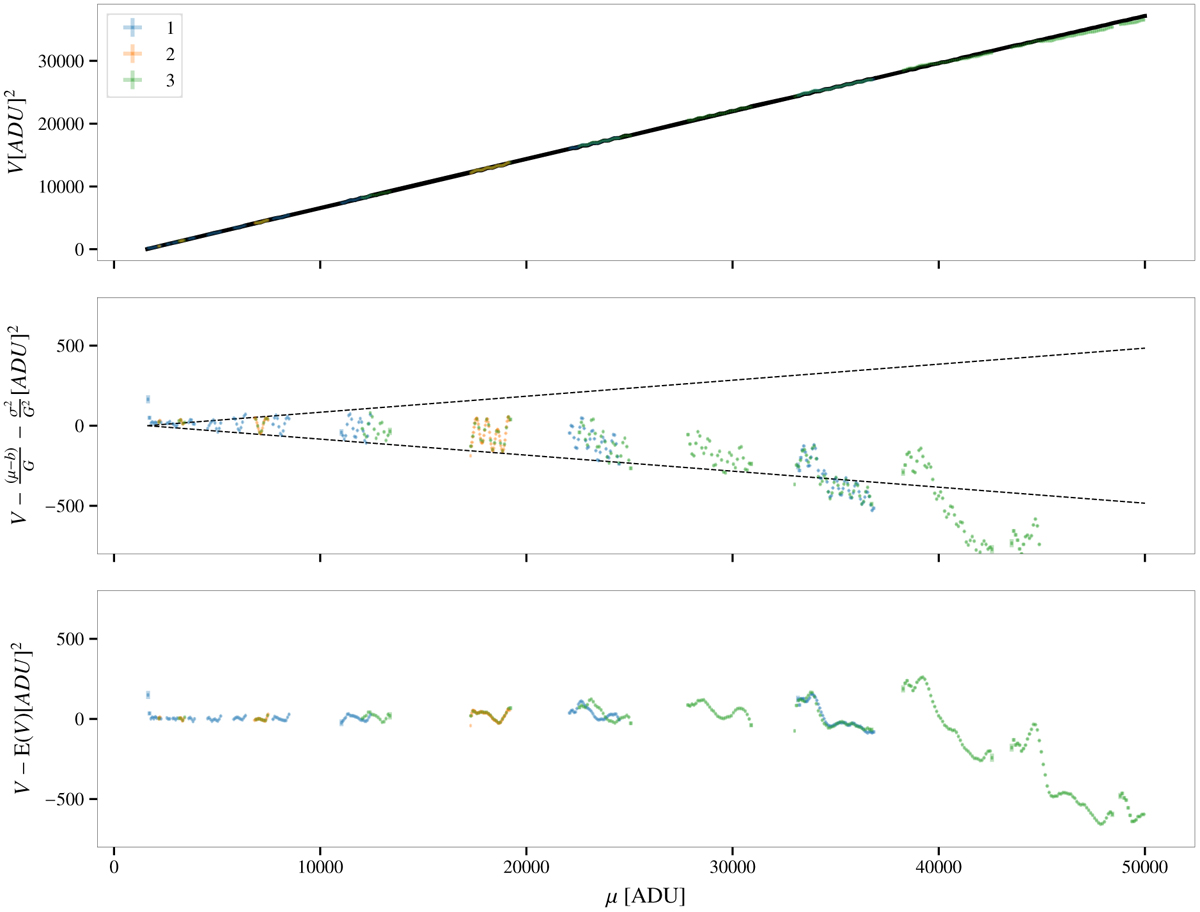
Photon transfer curve for the IMX411 sensor obtained from statistics build from individual physical pixels over the full scale. Top: the three colors correspond to three independent datasets obtained with different illumination levels and exposure times (see Table 3). The black solid line presents the linear relation from Eq. (A.9) using the best-fit gain value. Middle: residuals to the linear model. The dashed black lines show 1% variations of the integral gain. Bottom: residuals to the full model, including the effect of a 512-bit periodical DNL with 0.65 ADU of amplitude, and provision for curvature of the PTC due to influence of brighter-fatter-like effect in the physical pixels.
Current usage metrics show cumulative count of Article Views (full-text article views including HTML views, PDF and ePub downloads, according to the available data) and Abstracts Views on Vision4Press platform.
Data correspond to usage on the plateform after 2015. The current usage metrics is available 48-96 hours after online publication and is updated daily on week days.
Initial download of the metrics may take a while.