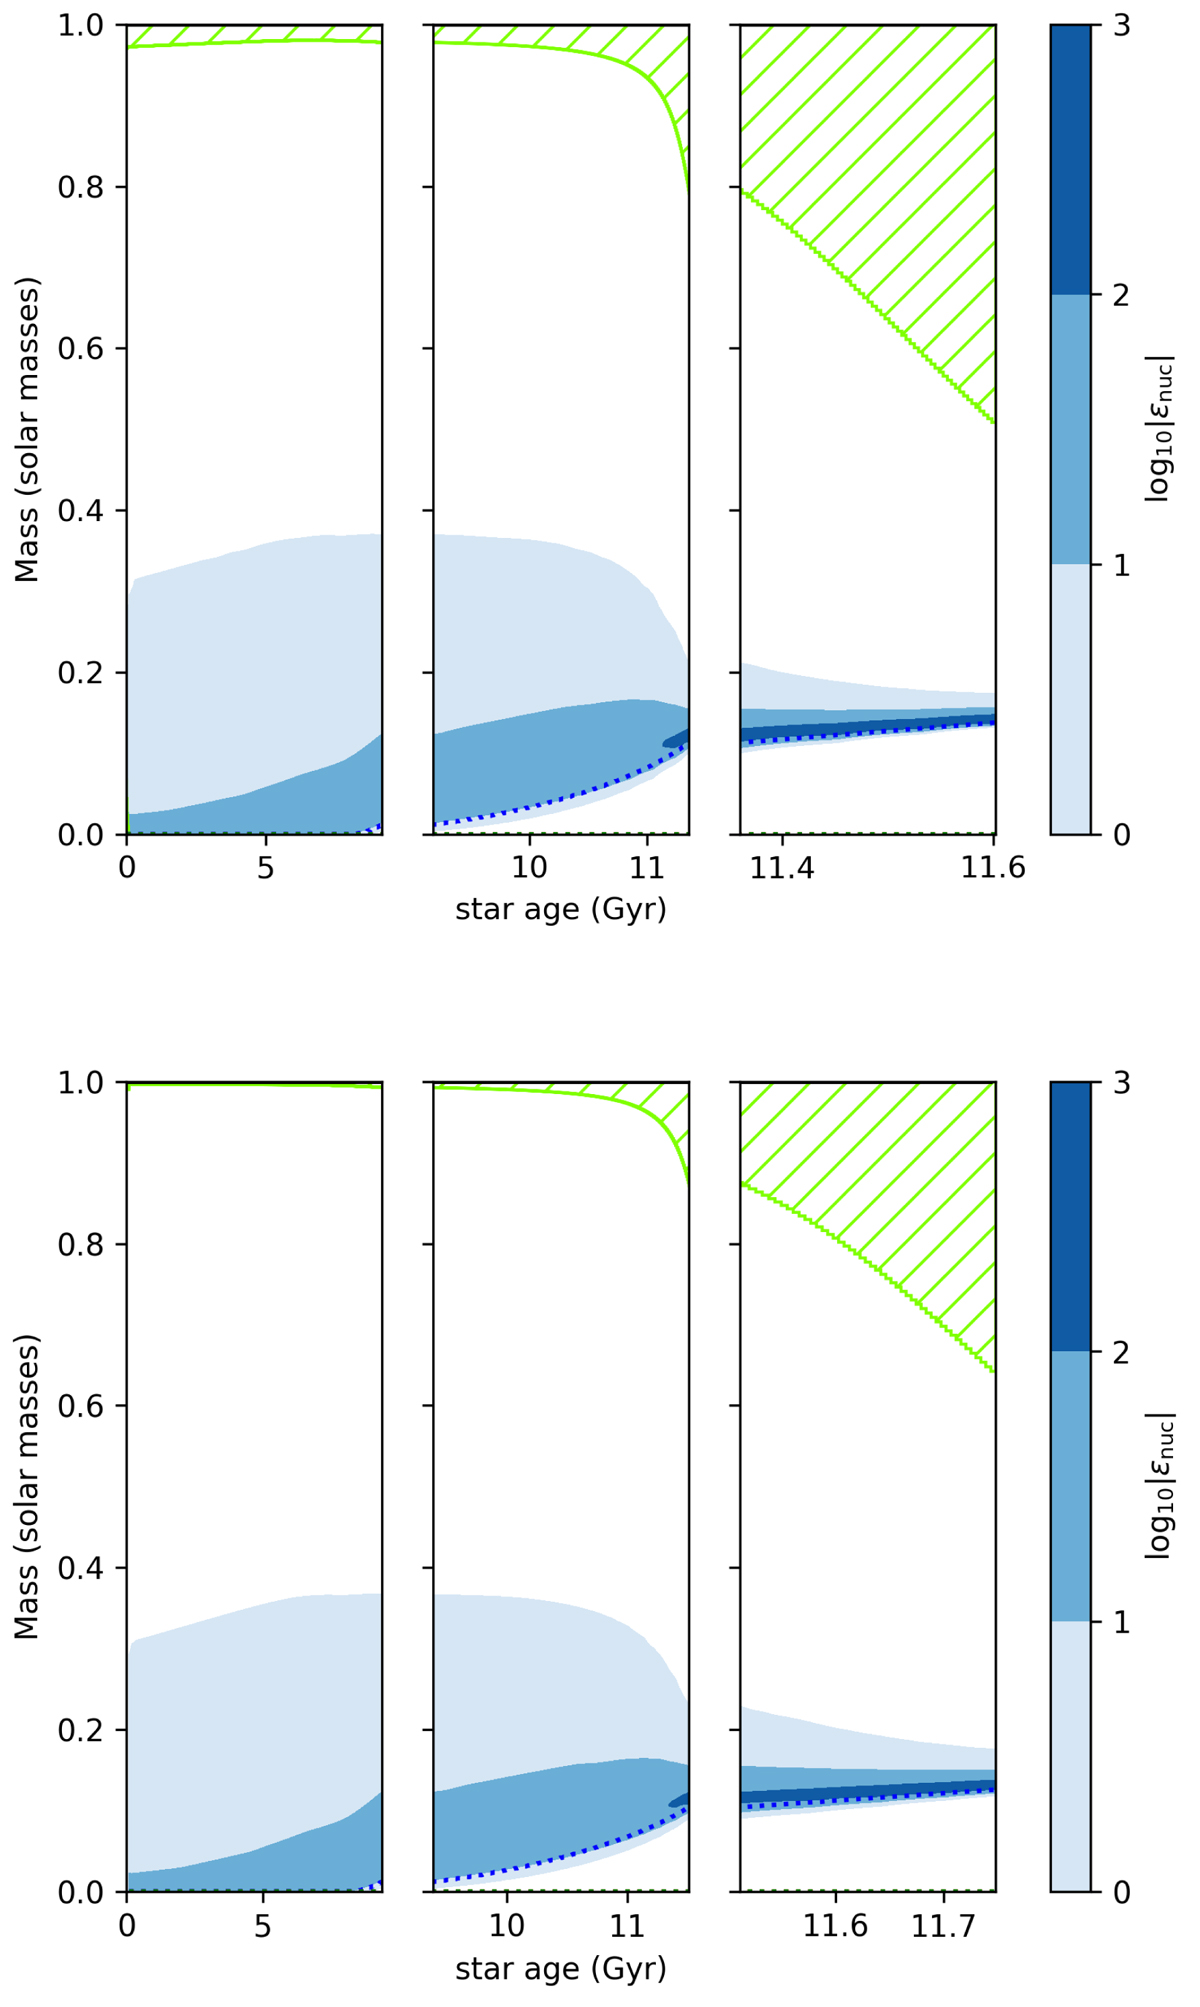
Fig. 4.
Download original image
Kippenhahn diagram for the standard model (top) and the set2-h10 model (bottom). The panels from left to right represent: Left: evolution from ZAMS to TAMS (defined as abundance of H first drops below 10−4 in the stellar core). Center: evolution from the TAMS to 90% of the remaining time. Right: final 10% of the post-TAMS evolution. The ordinate is the mass coordinate that runs from the center of the star to the surface. The nuclear energy generation rates are indicated by the different shades of blue. The green hatches indicate zones in which the energy transport is dominated by convection.
Current usage metrics show cumulative count of Article Views (full-text article views including HTML views, PDF and ePub downloads, according to the available data) and Abstracts Views on Vision4Press platform.
Data correspond to usage on the plateform after 2015. The current usage metrics is available 48-96 hours after online publication and is updated daily on week days.
Initial download of the metrics may take a while.