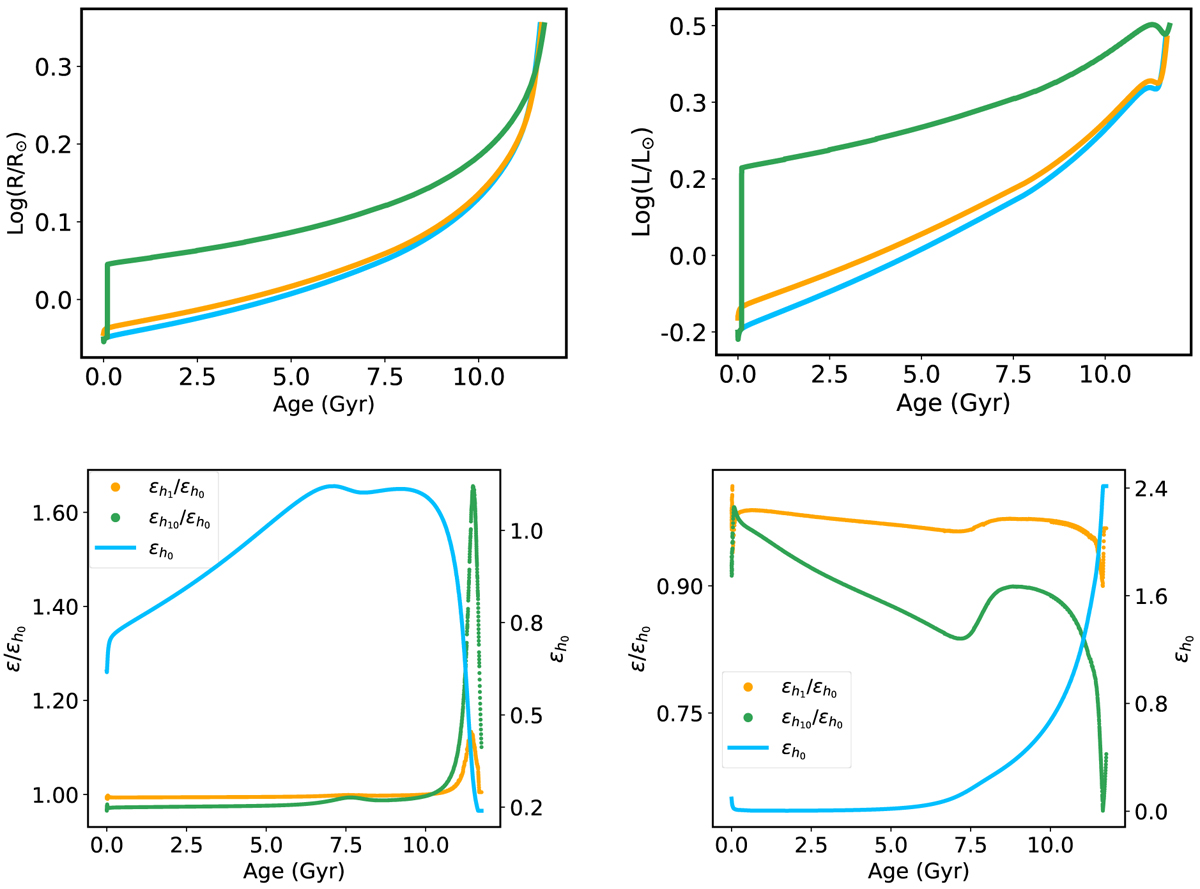
Fig. 2.
Download original image
Properties of the MESA models of set 2, in which the heating profile is introduced continuously throughout the evolutionary trajectory. Top: stellar radius (left) and luminosity (right). The blue curve corresponds to the nonheated models. The orange and green curves correspond, respectively, to the heating profile of model 63 and a heating profile that is ten times larger. Bottom: proton-proton reaction rate power (left) and CNO reaction rate power (right). The blue curve corresponds to the nonheated models and its ordinate is on the right side of the plot and given in units of log(L⊙). The orange and green curves correspond to the ratio of rates in the heated and nonheated models, with colors the same as in the top panels.
Current usage metrics show cumulative count of Article Views (full-text article views including HTML views, PDF and ePub downloads, according to the available data) and Abstracts Views on Vision4Press platform.
Data correspond to usage on the plateform after 2015. The current usage metrics is available 48-96 hours after online publication and is updated daily on week days.
Initial download of the metrics may take a while.