Fig. A.9.
Download original image
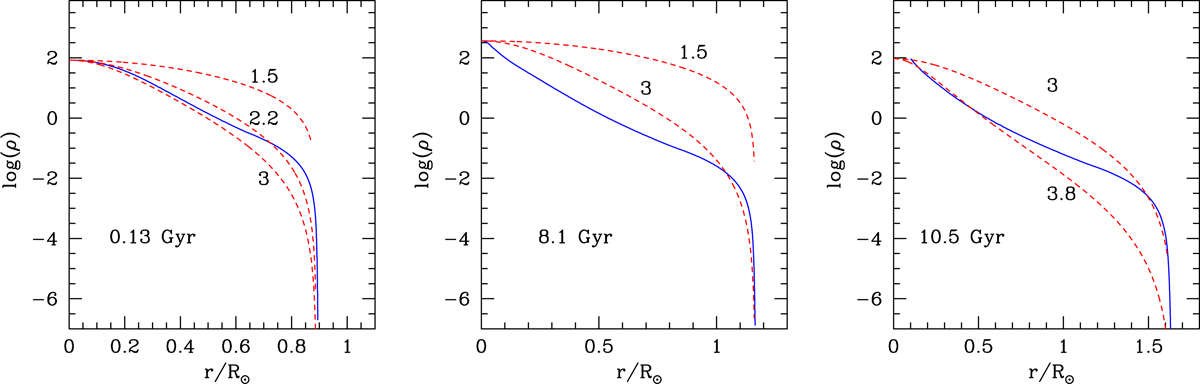
Density structure of the MESA models (blue) compared to a polytropic structure (red dash). The MESA models are: Standard model at 0.13 Gyr (h0-3, top left) and at 8.1 Gyr (h0-11, top right) as well as the set 2 10x heated model at 10.5 Gyr (h10-22, bottom). The polytropes are labeled with their corresponding index, and their central density was chosen to coincide with that of the MESA models for illustration purposes. The density is given in units of g cm−3.
Current usage metrics show cumulative count of Article Views (full-text article views including HTML views, PDF and ePub downloads, according to the available data) and Abstracts Views on Vision4Press platform.
Data correspond to usage on the plateform after 2015. The current usage metrics is available 48-96 hours after online publication and is updated daily on week days.
Initial download of the metrics may take a while.