Fig. 8.

Download original image
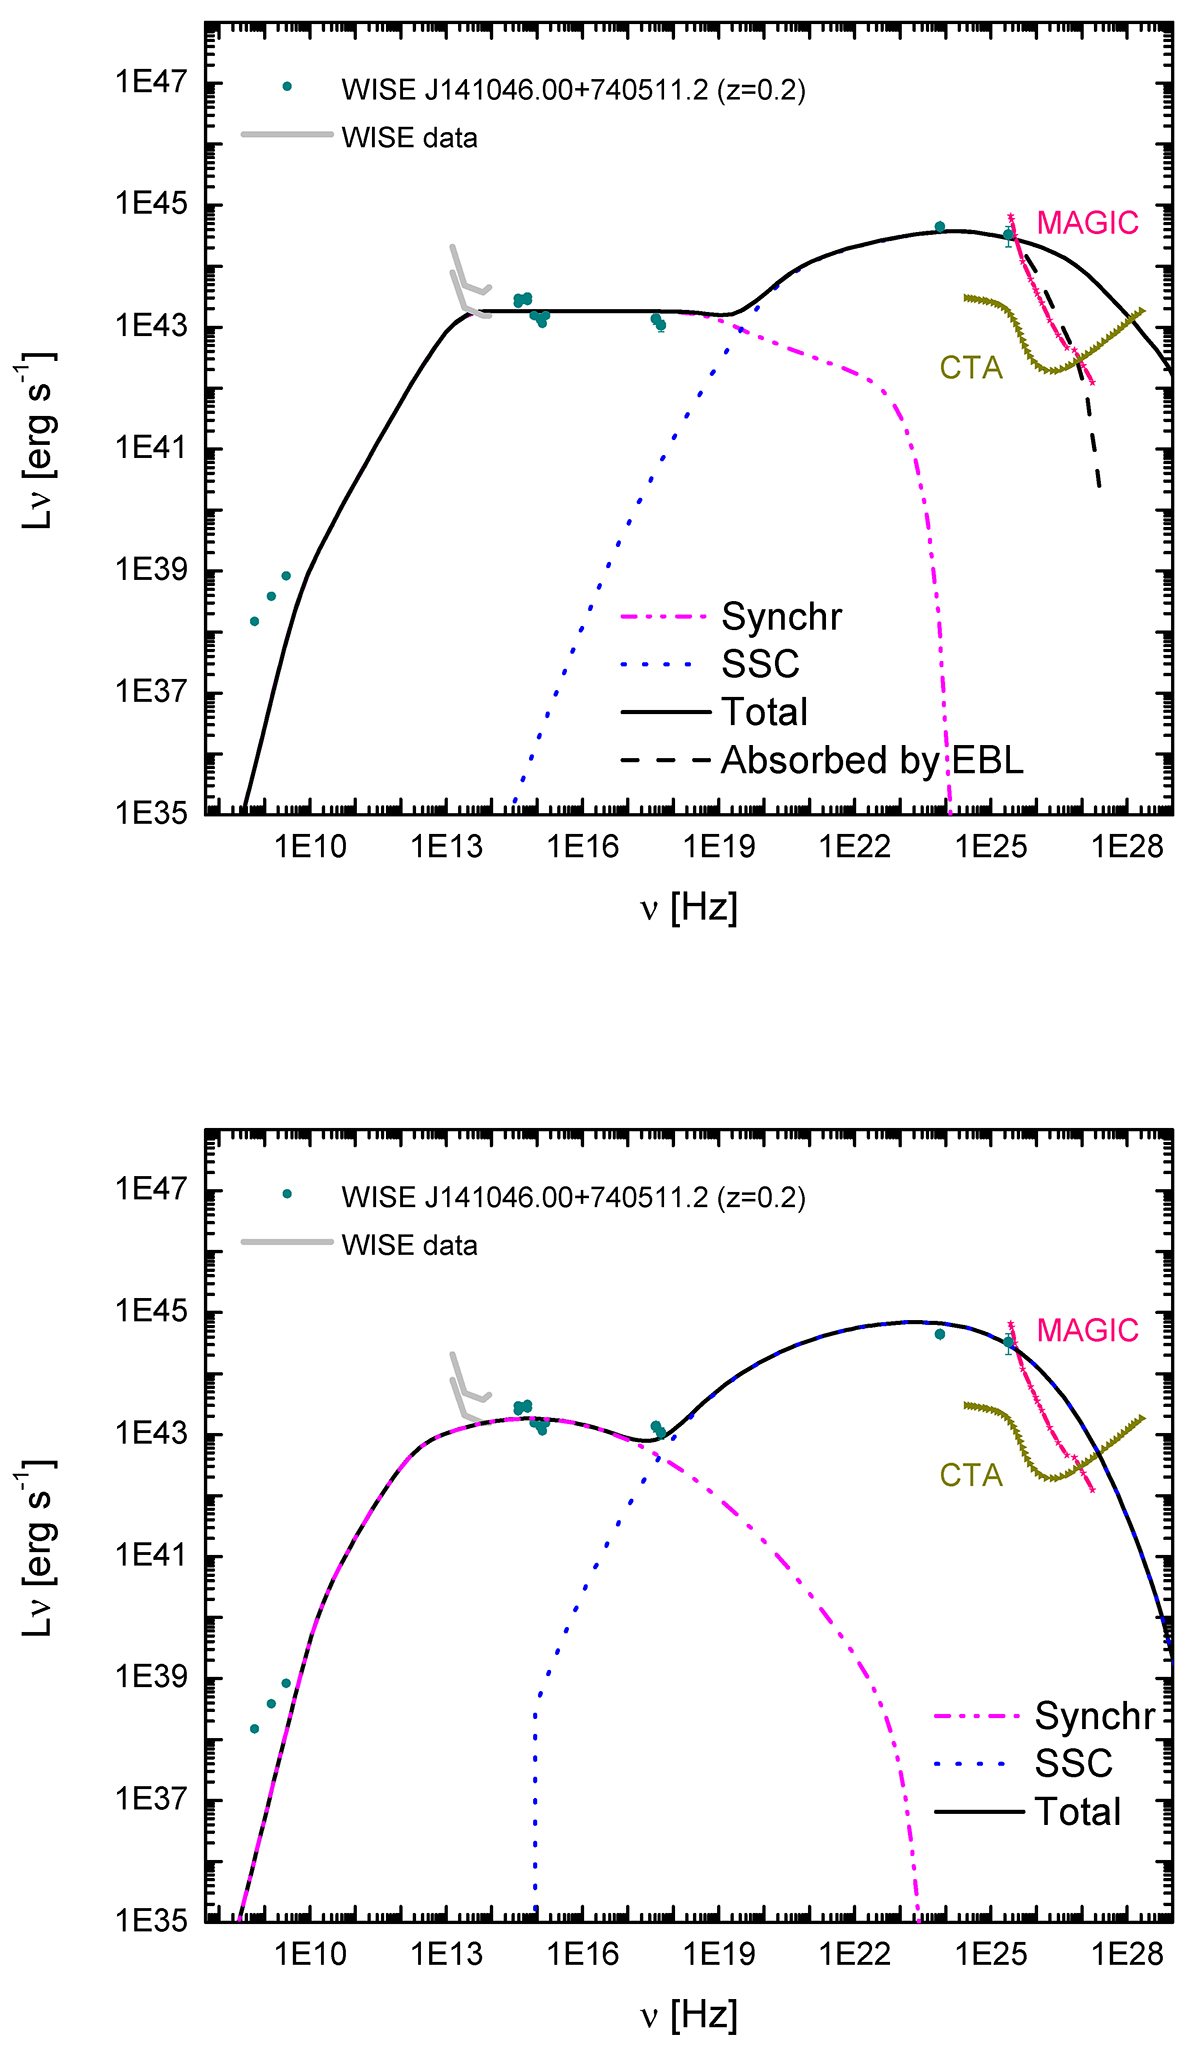
Broadband SED of WISE J141046.00+740511.2. The solid circles represent the simultaneous multiwavelength data of the source. Data from WISE, which are not contemporaneous, are shown in gray curves (maximum and minimum fluxes). The black solid line is the SED obtained with the leptonic one-zone model, using the best-fit parameter for the power-law distribution (top panel) and the log-parabolic one (bottom panel); dashed black line shows the SED absorbed by the EBL (Domínguez et al. 2011). The sensitivity curves of MAGIC (Aleksić et al. 2016) and CTA are also included.
Current usage metrics show cumulative count of Article Views (full-text article views including HTML views, PDF and ePub downloads, according to the available data) and Abstracts Views on Vision4Press platform.
Data correspond to usage on the plateform after 2015. The current usage metrics is available 48-96 hours after online publication and is updated daily on week days.
Initial download of the metrics may take a while.


