Fig. 5.

Download original image
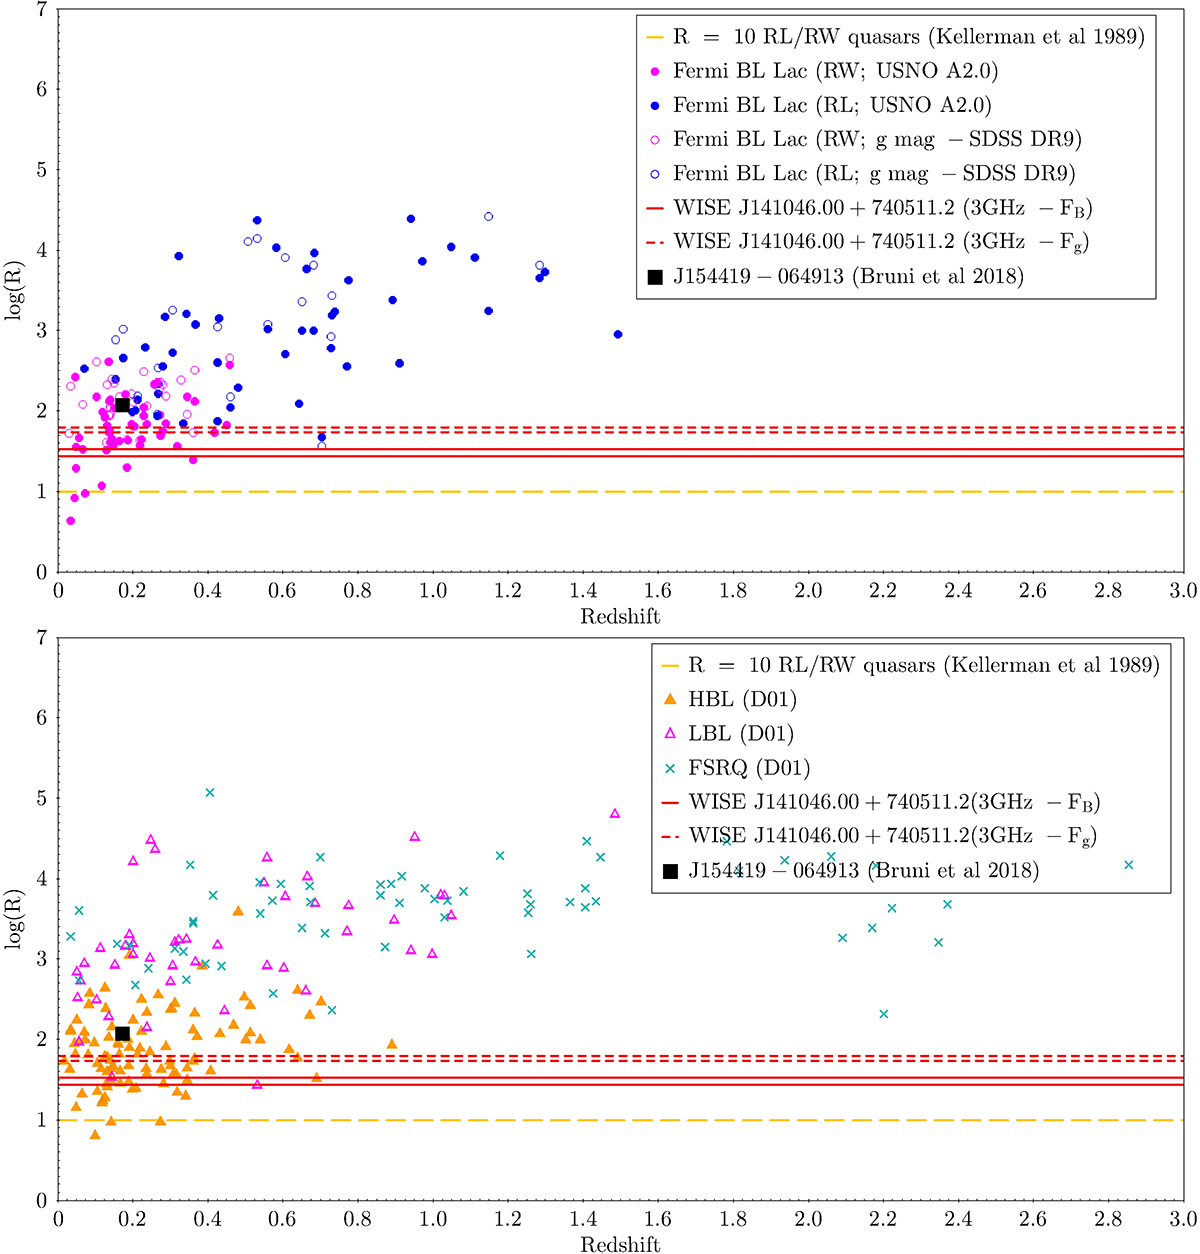
R parameter as a function of redshift. Data for WISE J141046.00+740511.2 are shown in red. R was calculated by using: B-fluxes from USNO and Gaia (red continuous lines) and g′-fluxes from WHT and Liverpool Telescope (the red dashed lines). Upper panel: BZCAT subsamples (set on the basis of their L1.4 GHz; see Fig. 4). Filled (empty) circles denote that R was calculated by using B-fluxes from USNO A2.0 (g′-fluxes from SDSS DR9) data. Lower panel: comparison of R values between different blazar-types and WISE J141046.00+740511.2.
Current usage metrics show cumulative count of Article Views (full-text article views including HTML views, PDF and ePub downloads, according to the available data) and Abstracts Views on Vision4Press platform.
Data correspond to usage on the plateform after 2015. The current usage metrics is available 48-96 hours after online publication and is updated daily on week days.
Initial download of the metrics may take a while.


