Fig. 1.
Download original image
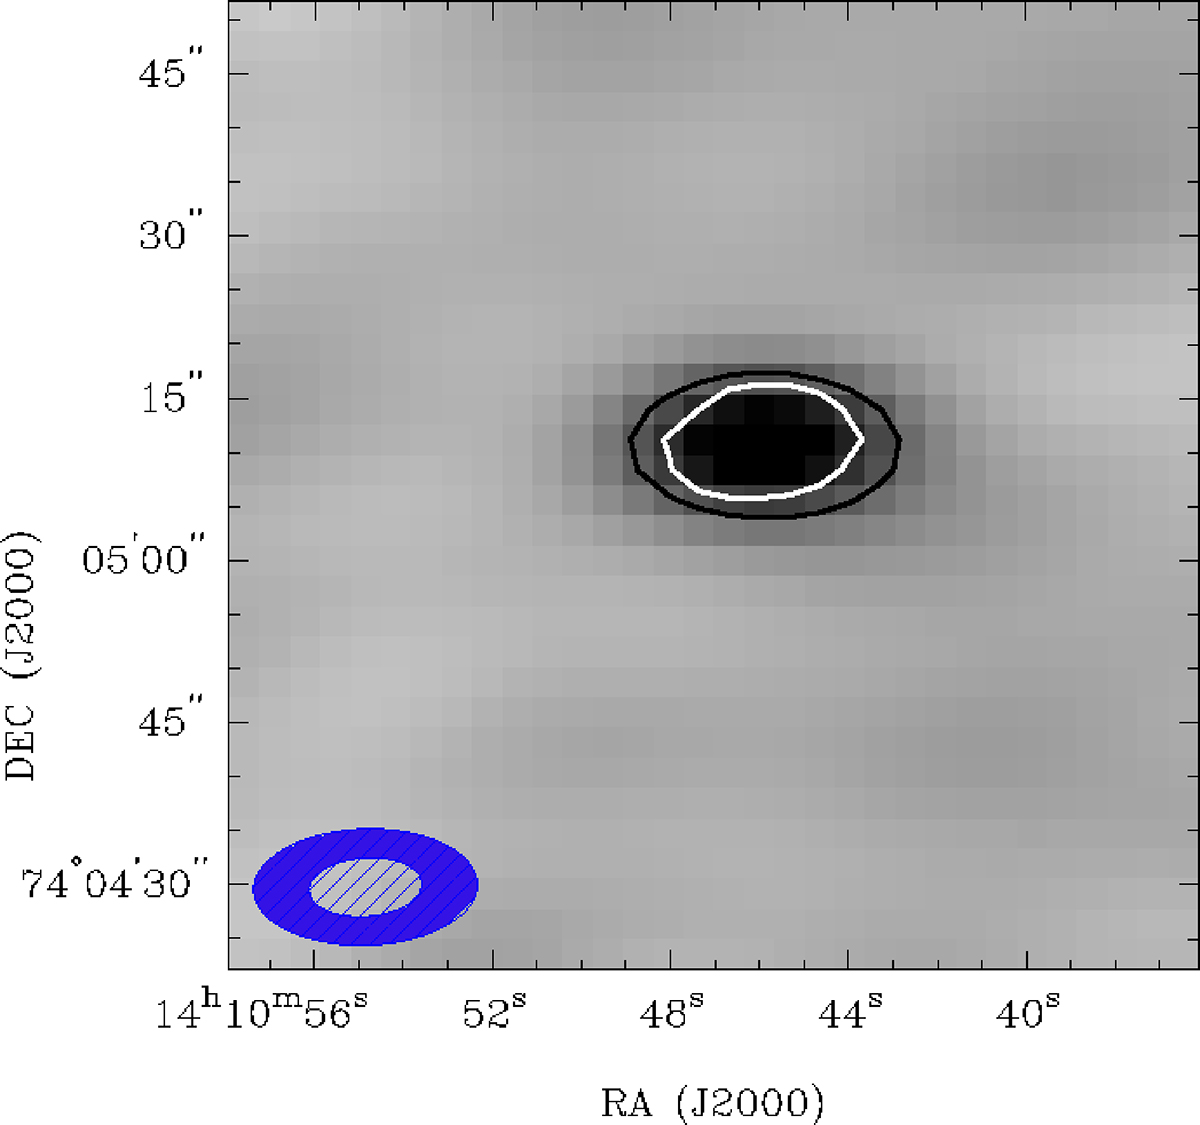
JVLA L-band map of WISE J141046.00+740511.2. The L-band (1.4 GHz) continuum image is overlaid with L-band (black) and S-band (3 GHz, white) contours. Contour levels are drawn at a 3σ image noise level, where σ is 0.3 mJy beam−1 and σ is 0.1 mJy beam−1 in the L and S bands, respectively. The synthesized beams of L and S bands are shown at the bottom left corner of the image, ![]() and
and ![]() , respectively.
, respectively.
Current usage metrics show cumulative count of Article Views (full-text article views including HTML views, PDF and ePub downloads, according to the available data) and Abstracts Views on Vision4Press platform.
Data correspond to usage on the plateform after 2015. The current usage metrics is available 48-96 hours after online publication and is updated daily on week days.
Initial download of the metrics may take a while.