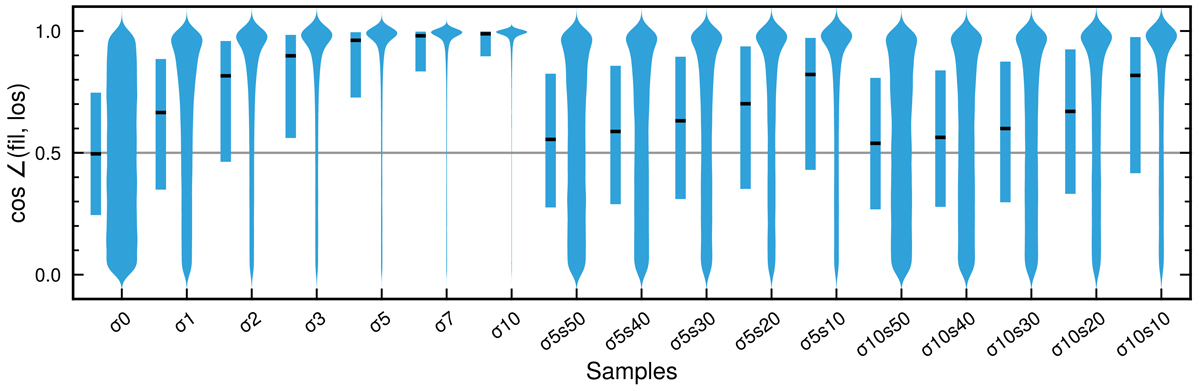
Fig. 4.
Download original image
Distributions of the cosine of the angle between filament spines (fil) and the line of sight (los). For each sample, there are two plots. The left one is a bar plot of the quartiles of the distribution, where the black crossbar indicates the second quartile (the median). The right plot is a violin plot that shows the density curve of the distribution. The horizontal grey line indicates the median value for a uniform distribution. The closer the distribution gets to value 1, the more filaments are parallel to the line of sight (z-axis in other plots).
Current usage metrics show cumulative count of Article Views (full-text article views including HTML views, PDF and ePub downloads, according to the available data) and Abstracts Views on Vision4Press platform.
Data correspond to usage on the plateform after 2015. The current usage metrics is available 48-96 hours after online publication and is updated daily on week days.
Initial download of the metrics may take a while.