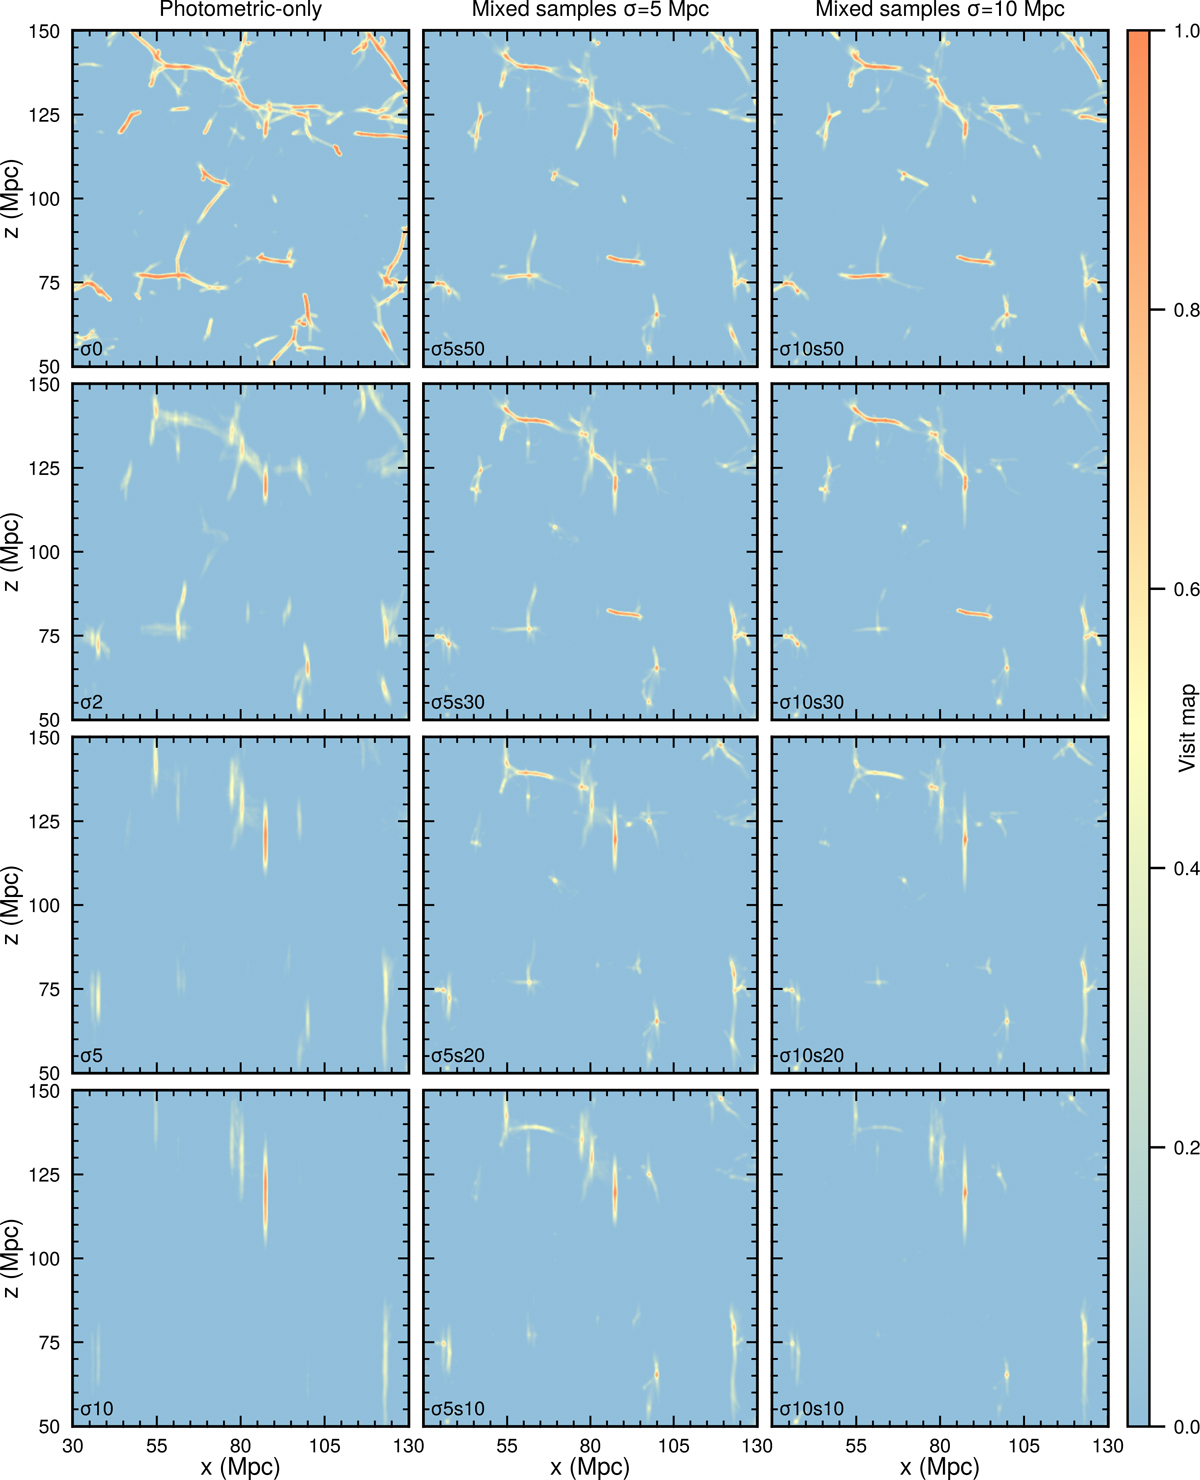
Fig. 3.
Download original image
Projections of maximum visit map values in slices obtained from the Bisous model using different samples. Only a smaller 100 Mpc × 100 Mpc area is shown for visual clarity. The thickness of the slice is 10 Mpc. Usually, a visit map limit of 0.05 is used to classify whether or not a coordinate is inside a filament. Therefore, everything besides the blue area is likely part of the filamentary network. The vertical axis (z) is parallel to the axis of the photometric uncertainties, i.e., it emulates the line of sight. The leftmost column shows samples with only photometric galaxies, the middle column shows mixed samples with medium uncertainties (σ = 5 Mpc) for photometric galaxies, and the rightmost column shows mixed samples with the larger uncertainties (σ = 10 Mpc). Different rows in the leftmost column have different photometric uncertainties, and the middle and the rightmost column have different fractions of the brightest galaxies as spectroscopic galaxies. See Table 1 and Sect. 2.3 for the sample naming convention used here.
Current usage metrics show cumulative count of Article Views (full-text article views including HTML views, PDF and ePub downloads, according to the available data) and Abstracts Views on Vision4Press platform.
Data correspond to usage on the plateform after 2015. The current usage metrics is available 48-96 hours after online publication and is updated daily on week days.
Initial download of the metrics may take a while.