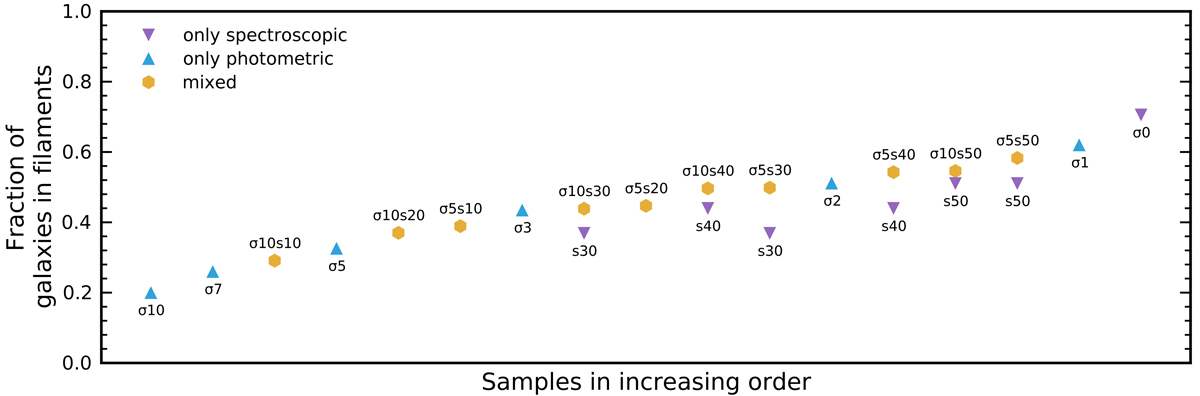
Fig. 2.
Download original image
Fraction of galaxies in filaments for different spectroscopic-only, photometric-only, and mixed samples. The samples are ordered so that the y-axis values of photometric-only and mixed samples are in increasing order. The spectroscopic-only samples are used for reference values to show the increase in the fraction of galaxies in filaments for mixed samples. The sample s30 is the smallest spectroscopic sample in this study because smaller samples had too few galaxies to be able to detect the filamentary network.
Current usage metrics show cumulative count of Article Views (full-text article views including HTML views, PDF and ePub downloads, according to the available data) and Abstracts Views on Vision4Press platform.
Data correspond to usage on the plateform after 2015. The current usage metrics is available 48-96 hours after online publication and is updated daily on week days.
Initial download of the metrics may take a while.