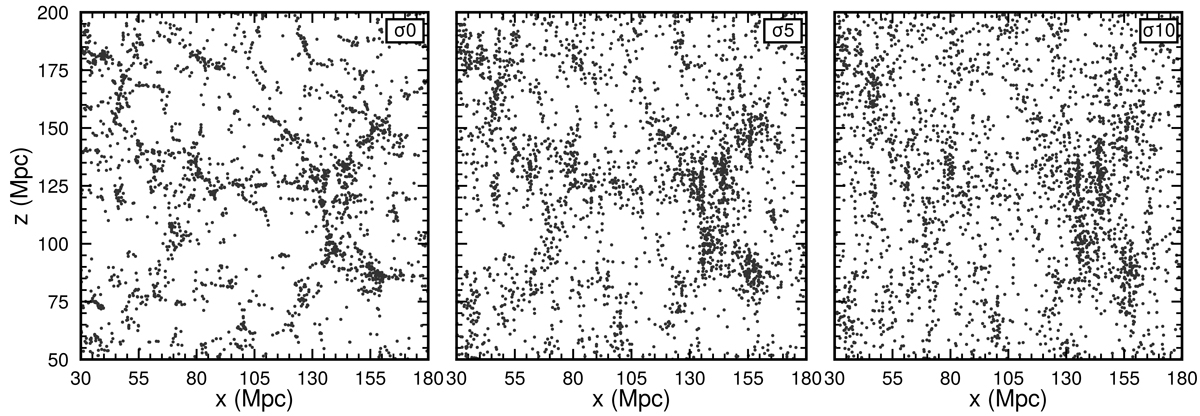
Fig. 1.
Download original image
Projection of galaxy distributions of samples σ0, σ5, σ10 in a slice with a thickness of 10 Mpc. Each dot represents a galaxy. The photometric uncertainties are parallel to the z-axis, which also defines the line of sight in this work. Only an area of 150 Mpc × 150 Mpc is shown for visual clarity. For information about samples; see Sect. 2.3.
Current usage metrics show cumulative count of Article Views (full-text article views including HTML views, PDF and ePub downloads, according to the available data) and Abstracts Views on Vision4Press platform.
Data correspond to usage on the plateform after 2015. The current usage metrics is available 48-96 hours after online publication and is updated daily on week days.
Initial download of the metrics may take a while.