Fig. 9
Download original image
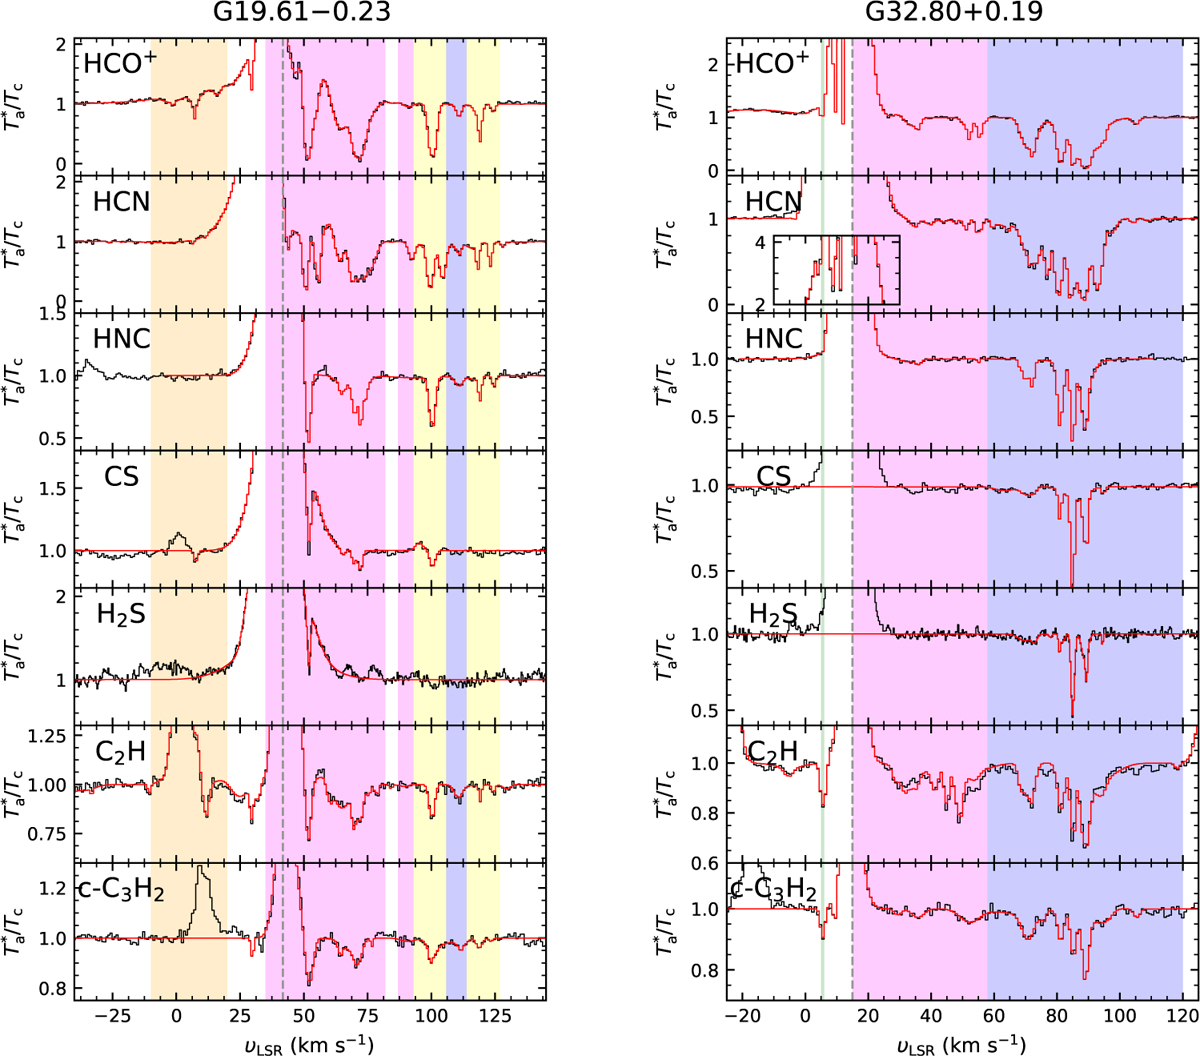
Same as Fig. 3 but toward G19.61–0.12 and G32.80+0.19. The shaded areas indicate velocity intervals of specific spiral arms (Aquila-Rift in green, Sagittarius-Carina arm in magenta, Scutum-Centaurus arm in blue, inter-arm gas in orange, the GC/bar in yellow), and the molecular cloud envelope or unidentified foreground clouds in brown. Toward G32.80+0.19, the insert in the HCN panel zooms in on the HCN absorption features on top of the emission within a velocity window between –10 and 30 km s–1.
Current usage metrics show cumulative count of Article Views (full-text article views including HTML views, PDF and ePub downloads, according to the available data) and Abstracts Views on Vision4Press platform.
Data correspond to usage on the plateform after 2015. The current usage metrics is available 48-96 hours after online publication and is updated daily on week days.
Initial download of the metrics may take a while.