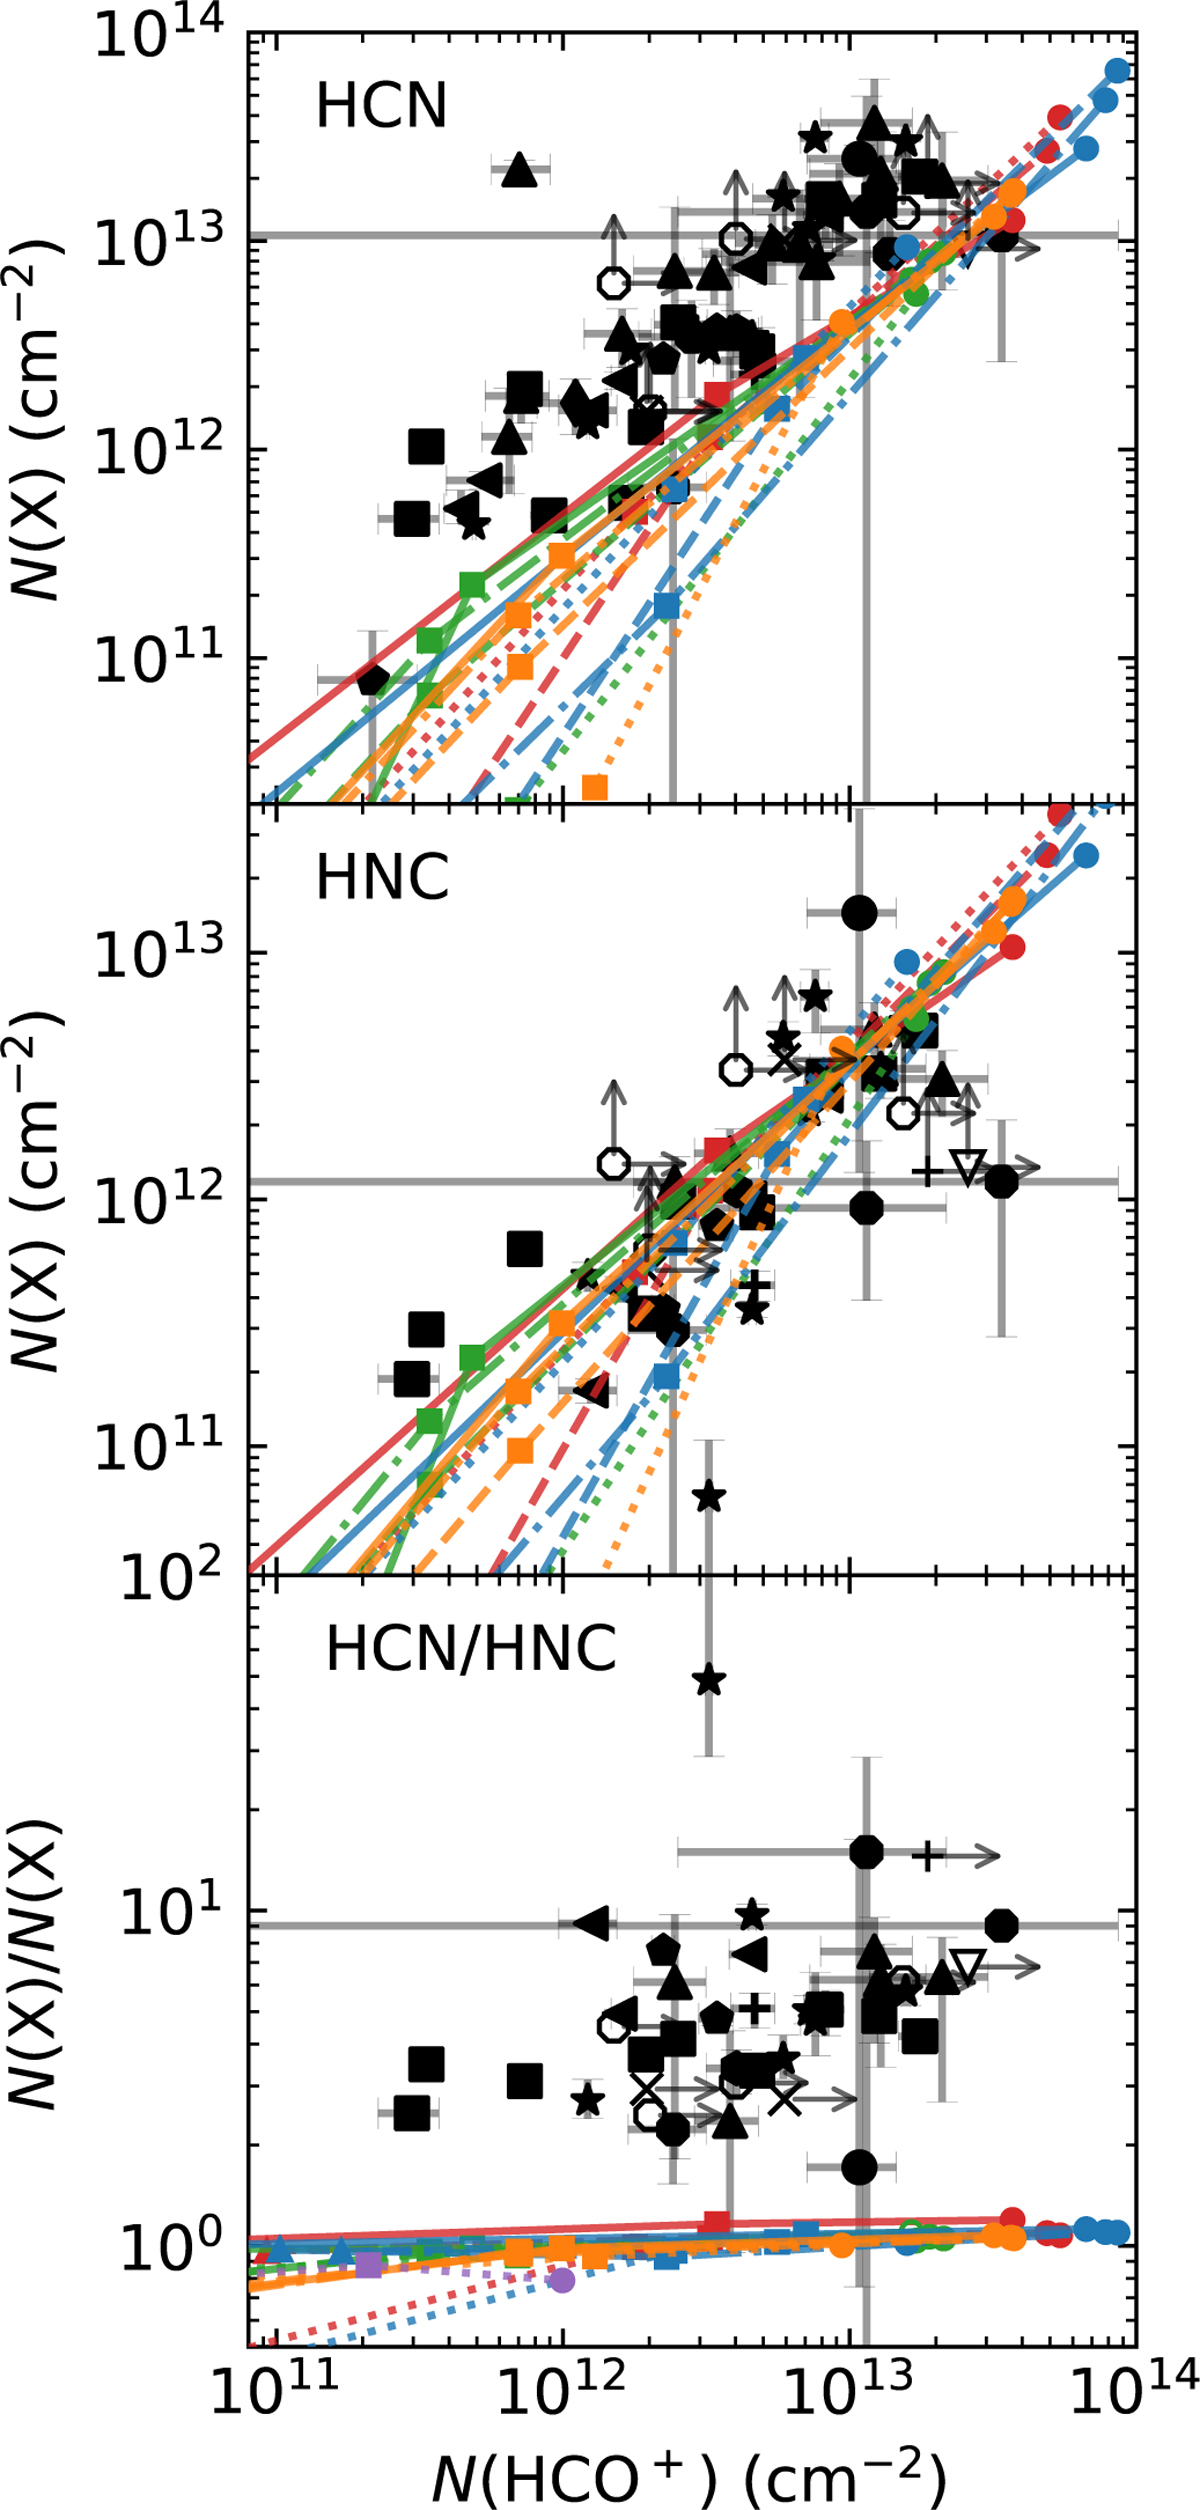
Fig. 23
Download original image
Column densities of HCN and HNC and their column density ratio as a function of N(HCO+), with predictions from isobaric PDR models overlaid. Filled and unfilled black markers indicate foreground components and molecular envelope components observed, respectively. The arrows refer to lower limits of N(X), and the markers are as same as Fig. 20. Each color represents different radiation field strengths and cosmic-ray ionization rates; red: G0 = 1 and ζ = 5 × 10⁻¹⁷ s−1 green: G0 = 100 and ζ = 5 × 10⁻¹⁷ s−1 blue: G0 = 1 and ζ = 1 × 10⁻¹⁶ s−1 orange: G0 = 100 and ζ = 1 × 10⁻¹⁶ s−1 and purple: G0 = 100 and ζ = 1 × 10⁻¹⁵ s−1 Initial pressures of 1000, 3000, 5000, 10 000 K cm−3 are indicated with dotted-, dashed-, dashed-dotted-, and solid-lines, respectively. Av =1, 5, and 10 mag are marked with colored triangles, squares, and circles, respectively.
Current usage metrics show cumulative count of Article Views (full-text article views including HTML views, PDF and ePub downloads, according to the available data) and Abstracts Views on Vision4Press platform.
Data correspond to usage on the plateform after 2015. The current usage metrics is available 48-96 hours after online publication and is updated daily on week days.
Initial download of the metrics may take a while.