Open Access
Fig. 22
Download original image
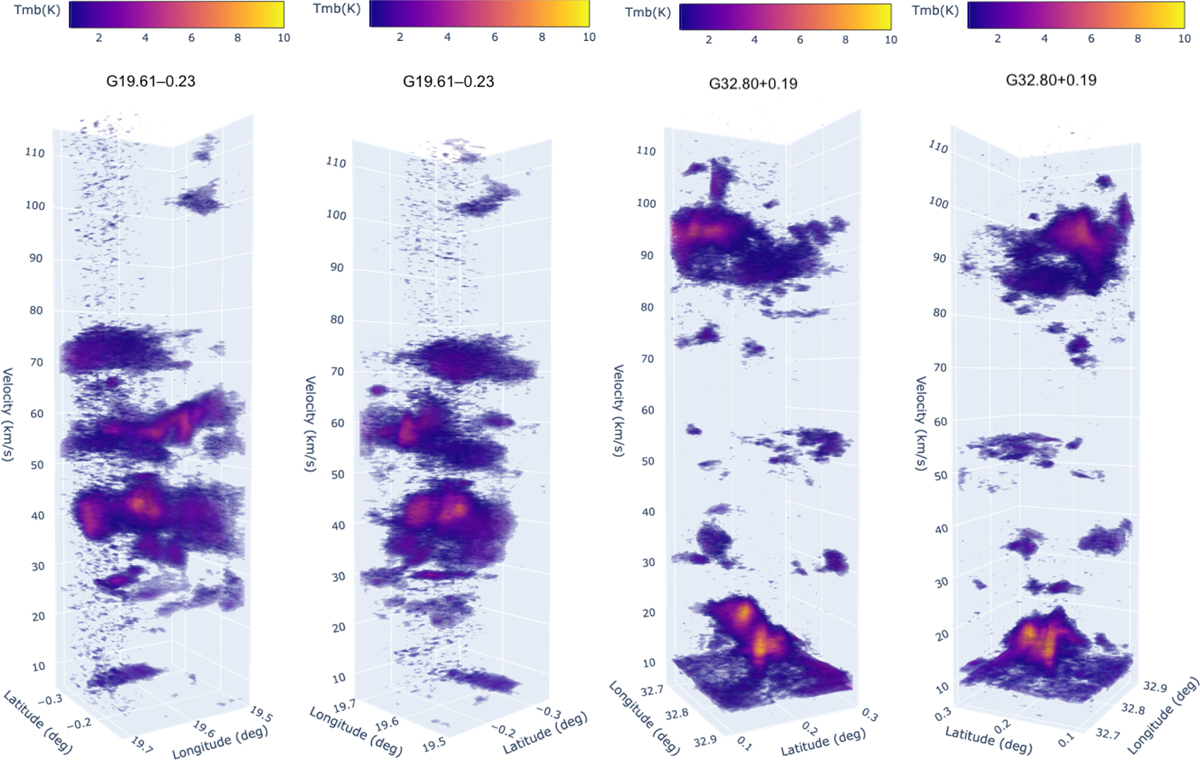
Position-position-velocity images of 13CO emission using data taken from the GRS survey toward two selected sightlines; G19.61−0.23 (approximately 90° angle difference between left two images) and G32.80+0.19 (approximately 90° angle difference between right two images).
Current usage metrics show cumulative count of Article Views (full-text article views including HTML views, PDF and ePub downloads, according to the available data) and Abstracts Views on Vision4Press platform.
Data correspond to usage on the plateform after 2015. The current usage metrics is available 48-96 hours after online publication and is updated daily on week days.
Initial download of the metrics may take a while.