Fig. 21

Download original image
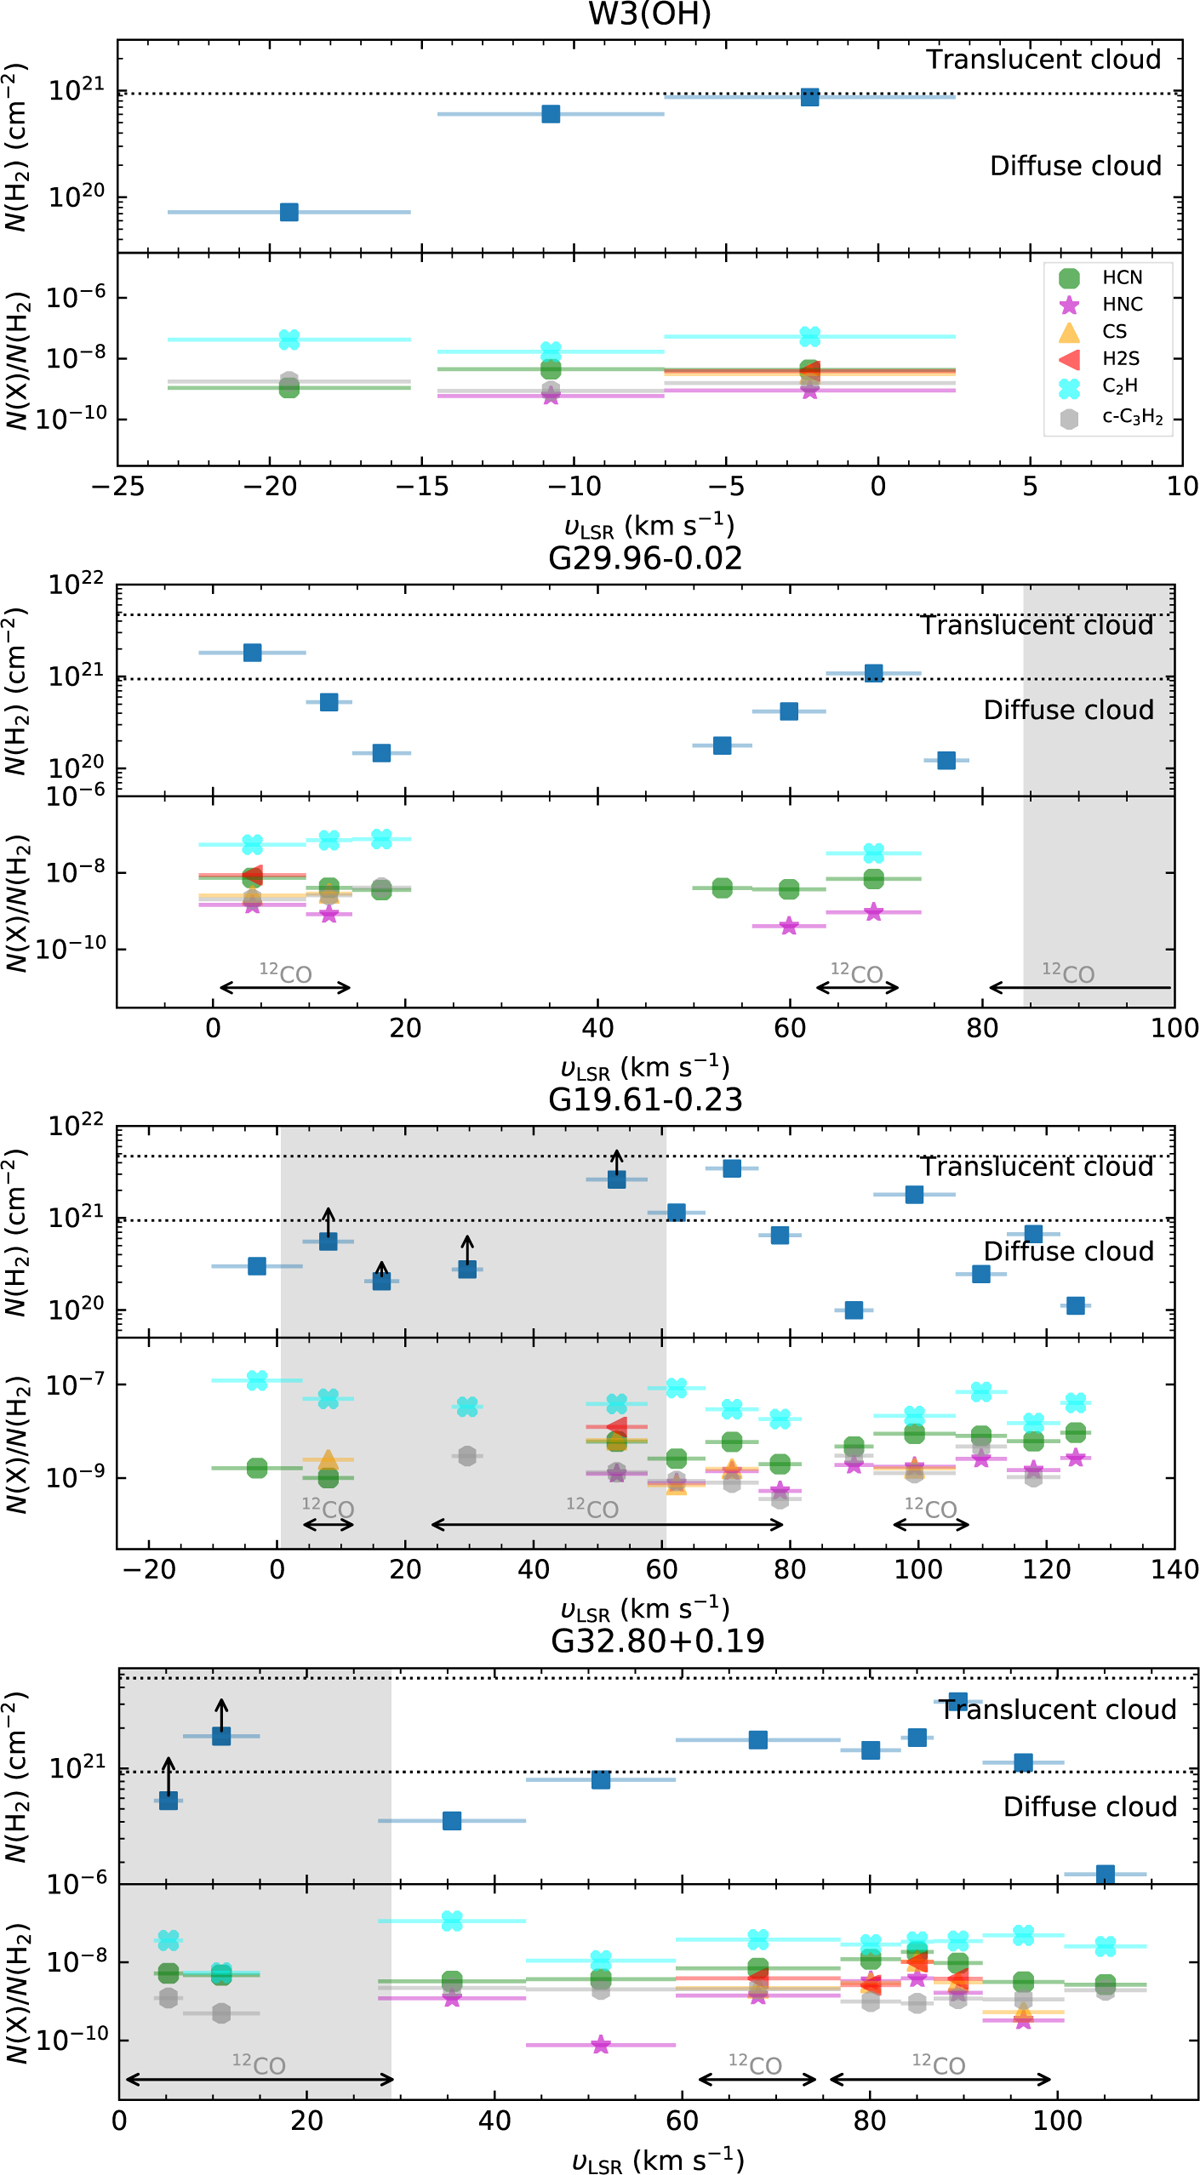
N(H2) and N(X)/N(H2) ratio integrated over specific velocity intervals from top to bottom toward W3(OH), G29.96−0.02, G19.61−0.23, and G32.80+0.19. Different species are labeled with different symbols and colors as shown in the legend displayed in the right-hand corner of the top panel. The gray areas indicate the velocity ranges of the emission lines. In the upper panels, the dotted horizontal lines correspond to Av of 1 and 5, respectively. In the lower panels, the black horizontal arrows indicate the velocity ranges in which CO emission features have been detected from archival data at its given sensitivity. All the other sources are displayed in Figs. E.1 and E.2.
Current usage metrics show cumulative count of Article Views (full-text article views including HTML views, PDF and ePub downloads, according to the available data) and Abstracts Views on Vision4Press platform.
Data correspond to usage on the plateform after 2015. The current usage metrics is available 48-96 hours after online publication and is updated daily on week days.
Initial download of the metrics may take a while.


