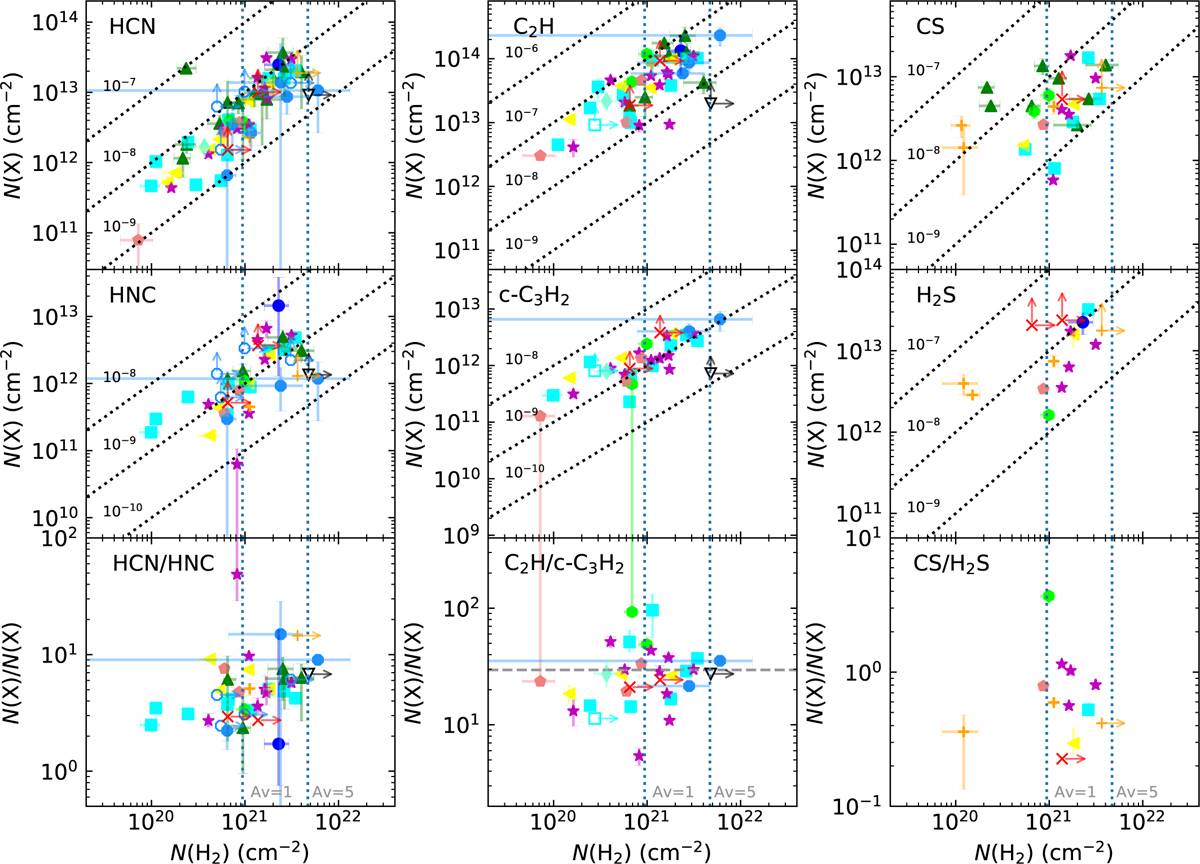
Fig. 20
Download original image
Comparison of the column density of the presented molecular species and N(H2). Each colored symbol represents different individual clouds in the sightline toward the observed background continuum sources (DR2l: red X, G09.62+0.19: blue circle, G10.47 +0.03: green up-triangle, G19.61−0.23: cyan square, G29.96−0.02: yellow left-triangle, G31.41+0.31: lime hexagon, G32.80+0.19: magenta star, G45.07+0.13: orange cross, NGC 6334 I: black down-triangle, W3 IRS5: aquamarine thin diamond, W3(OH): light-coral pentagon, W43 MM1: dodger-blue octagon). Filled and unfilled markers indicate foreground components and molecular envelope components, respectively. For the molecular envelope components, only lower limits are marked by arrows instead of fitting uncertainty bars. Black diagonal dotted lines represent abundances of given molecules on the y-axis relative to N(H2) with their values labeled. In each panel, two vertical blue dotted lines indicate the visual extinction of 1 and 5, respectively. In the plot of N(C2H)/N(c-C3H2), the gray horizontal dashed line indicates a mean value of 30.26 in the column density ratio.
Current usage metrics show cumulative count of Article Views (full-text article views including HTML views, PDF and ePub downloads, according to the available data) and Abstracts Views on Vision4Press platform.
Data correspond to usage on the plateform after 2015. The current usage metrics is available 48-96 hours after online publication and is updated daily on week days.
Initial download of the metrics may take a while.