Fig. 2

Download original image
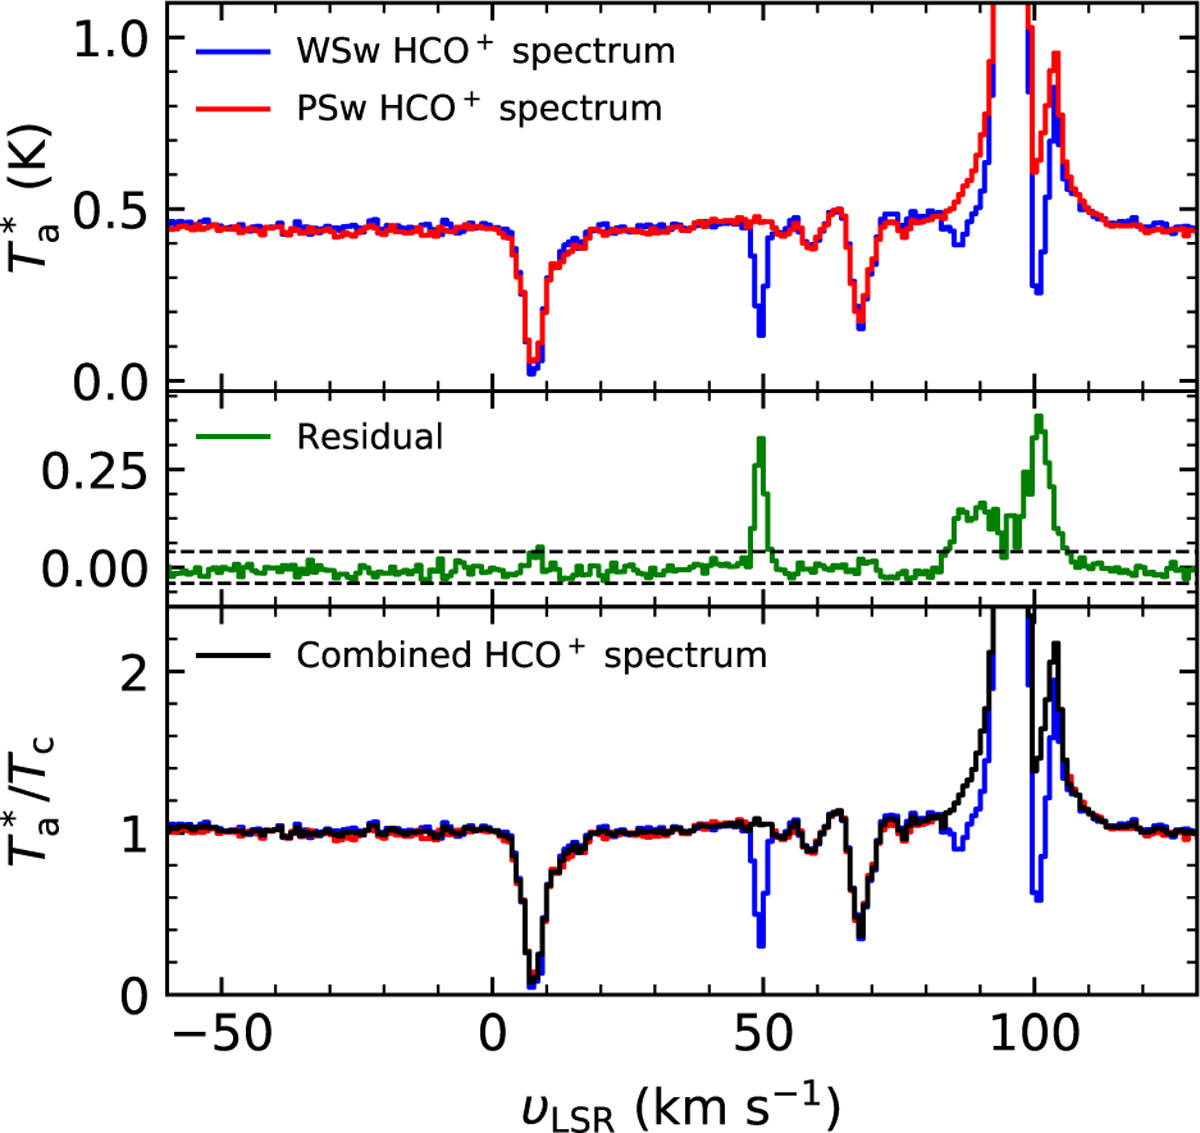
Comparison of the HCO+ spectra from observations with wobbler switching and position switching modes. The top panel shows the HCO+ spectra (velocities relative to the local standard of rest, LSR) taken with WSw (blue) and PSw (red) modes toward G29.96−0.02. The middle panel shows the residual spectrum (green) after fitting the WSw and PSw spectra. Black horizontal dashed lines mark the 3 rms level. The bottom panel presents the combined spectrum (black) of the WSw and rescaled PSw (![]() , where A and B are the slope and y-intercept of a linear least-squares regression fit, respectively), with the individual WSw and PSw spectra in the same colors as in the top panel.
, where A and B are the slope and y-intercept of a linear least-squares regression fit, respectively), with the individual WSw and PSw spectra in the same colors as in the top panel.
Current usage metrics show cumulative count of Article Views (full-text article views including HTML views, PDF and ePub downloads, according to the available data) and Abstracts Views on Vision4Press platform.
Data correspond to usage on the plateform after 2015. The current usage metrics is available 48-96 hours after online publication and is updated daily on week days.
Initial download of the metrics may take a while.


