Fig. 19
Download original image
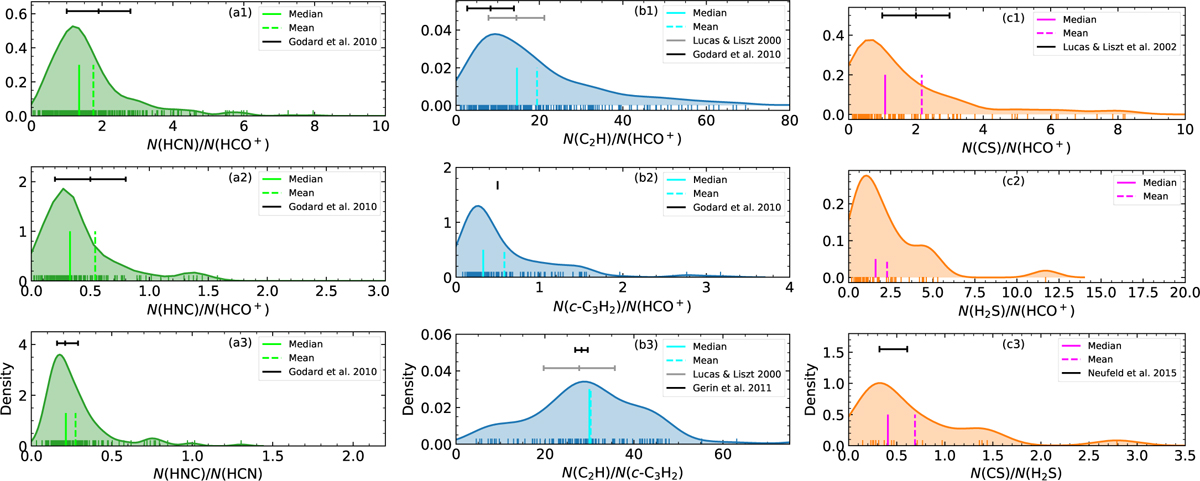
Kernel density estimate (KDE) distributions of the channel-wise column density ratios. Black and gray bars indicate unweighted mean ratio values measured from previous studies of absorption lines (Lucas & Liszt 2000, 2002; Godard et al. 2010; Gerin et al. 2011; Neufeld et al. 2015). Median and mean values of the KDE distributions are marked by solid and dashed vertical lines (in lime, cyan, and fuchsia).
Current usage metrics show cumulative count of Article Views (full-text article views including HTML views, PDF and ePub downloads, according to the available data) and Abstracts Views on Vision4Press platform.
Data correspond to usage on the plateform after 2015. The current usage metrics is available 48-96 hours after online publication and is updated daily on week days.
Initial download of the metrics may take a while.