Fig. 13
Download original image
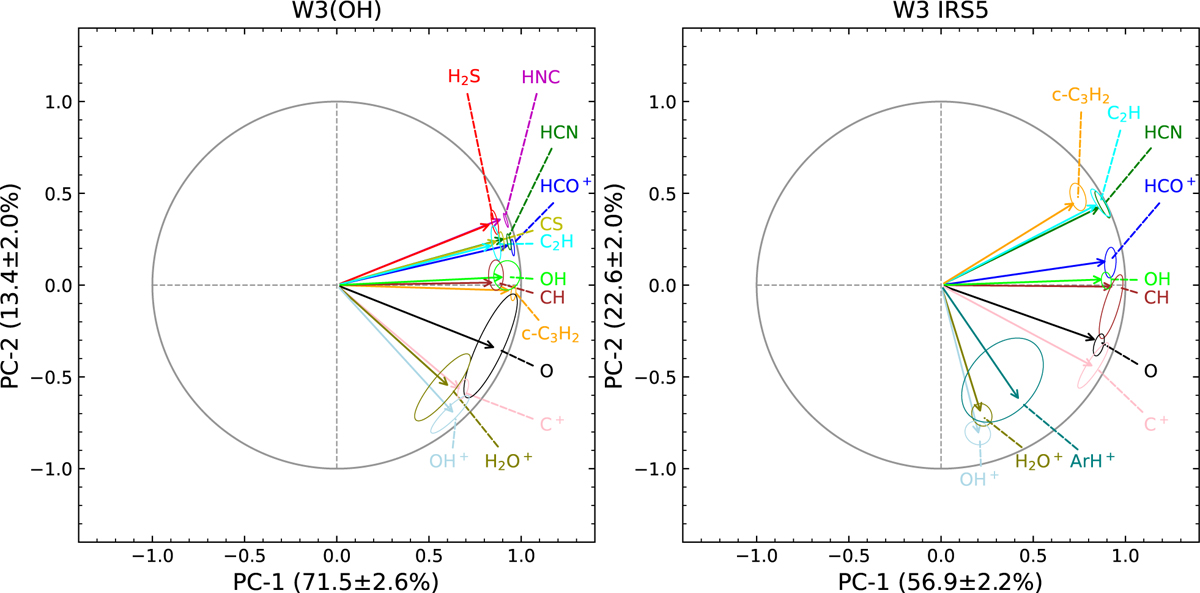
Variable correlation circle plots for the first and second PCs toward W3(OH) in the left panel and W3 IRS5 in the right panel. The solid straight lines close to the unit circle imply PC-1 and PC-2 contain the most information about the variables. Different colors are used to denote the different species analyzed. Each colored ellipse is a 2σ confidence interval for the uncertainty of the PCA results for the corresponding species.
Current usage metrics show cumulative count of Article Views (full-text article views including HTML views, PDF and ePub downloads, according to the available data) and Abstracts Views on Vision4Press platform.
Data correspond to usage on the plateform after 2015. The current usage metrics is available 48-96 hours after online publication and is updated daily on week days.
Initial download of the metrics may take a while.