Fig. 12
Download original image
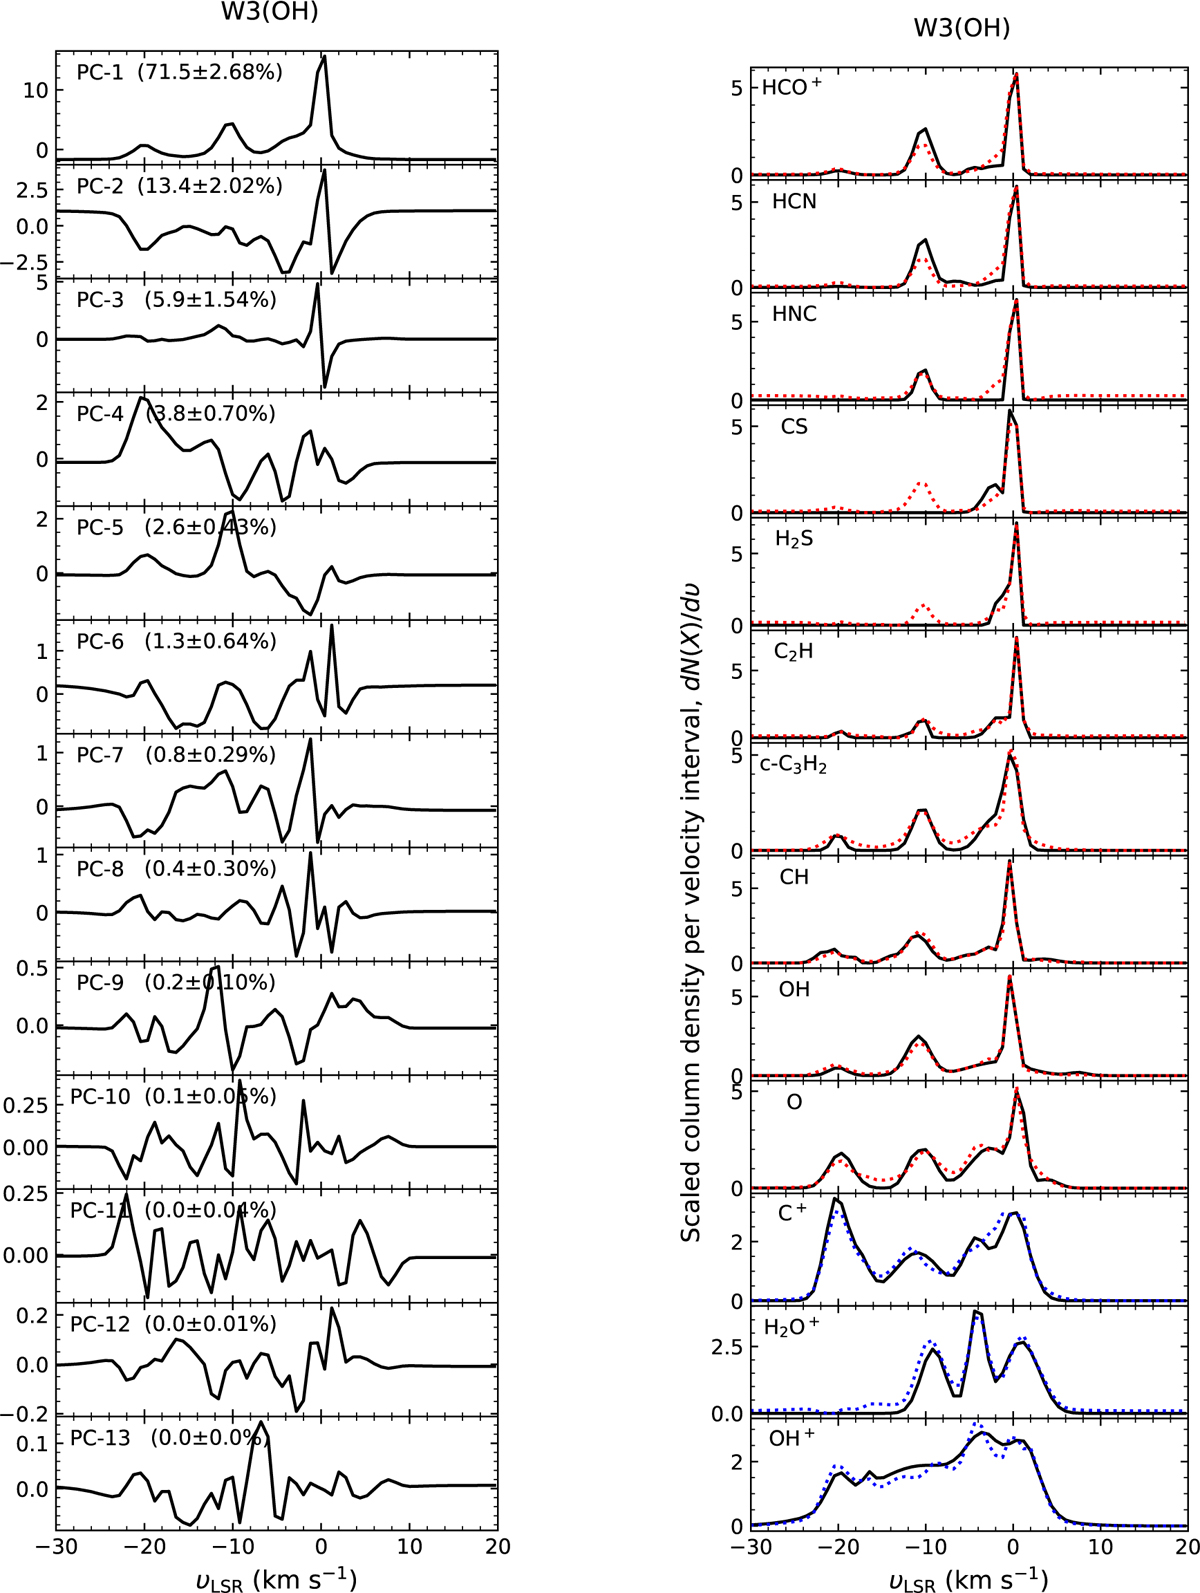
Left: Eigen spectra of thirteen principal components with percentage of variances as well as uncertainties (2σ), toward W3(OH). Right: scaled channel-wise column density spectra for the thirteen species (HCO+, HCN, HNC, CS, H2S, C2H, c-C3H2, CH, OH, O, C+, H2O+, and OH+) as a function of vLSR. Black curves represent the observational data, and red dotted curves are the spectra reproduced with only the first three principal components (PC-1, PC-2, and PC-3). For C+, H2O+, and OH+, the reproduced spectra indicated by blue dotted curves include one or two more PCs, i.e., PC-4 and PC-5.
Current usage metrics show cumulative count of Article Views (full-text article views including HTML views, PDF and ePub downloads, according to the available data) and Abstracts Views on Vision4Press platform.
Data correspond to usage on the plateform after 2015. The current usage metrics is available 48-96 hours after online publication and is updated daily on week days.
Initial download of the metrics may take a while.