Fig. 11
Download original image
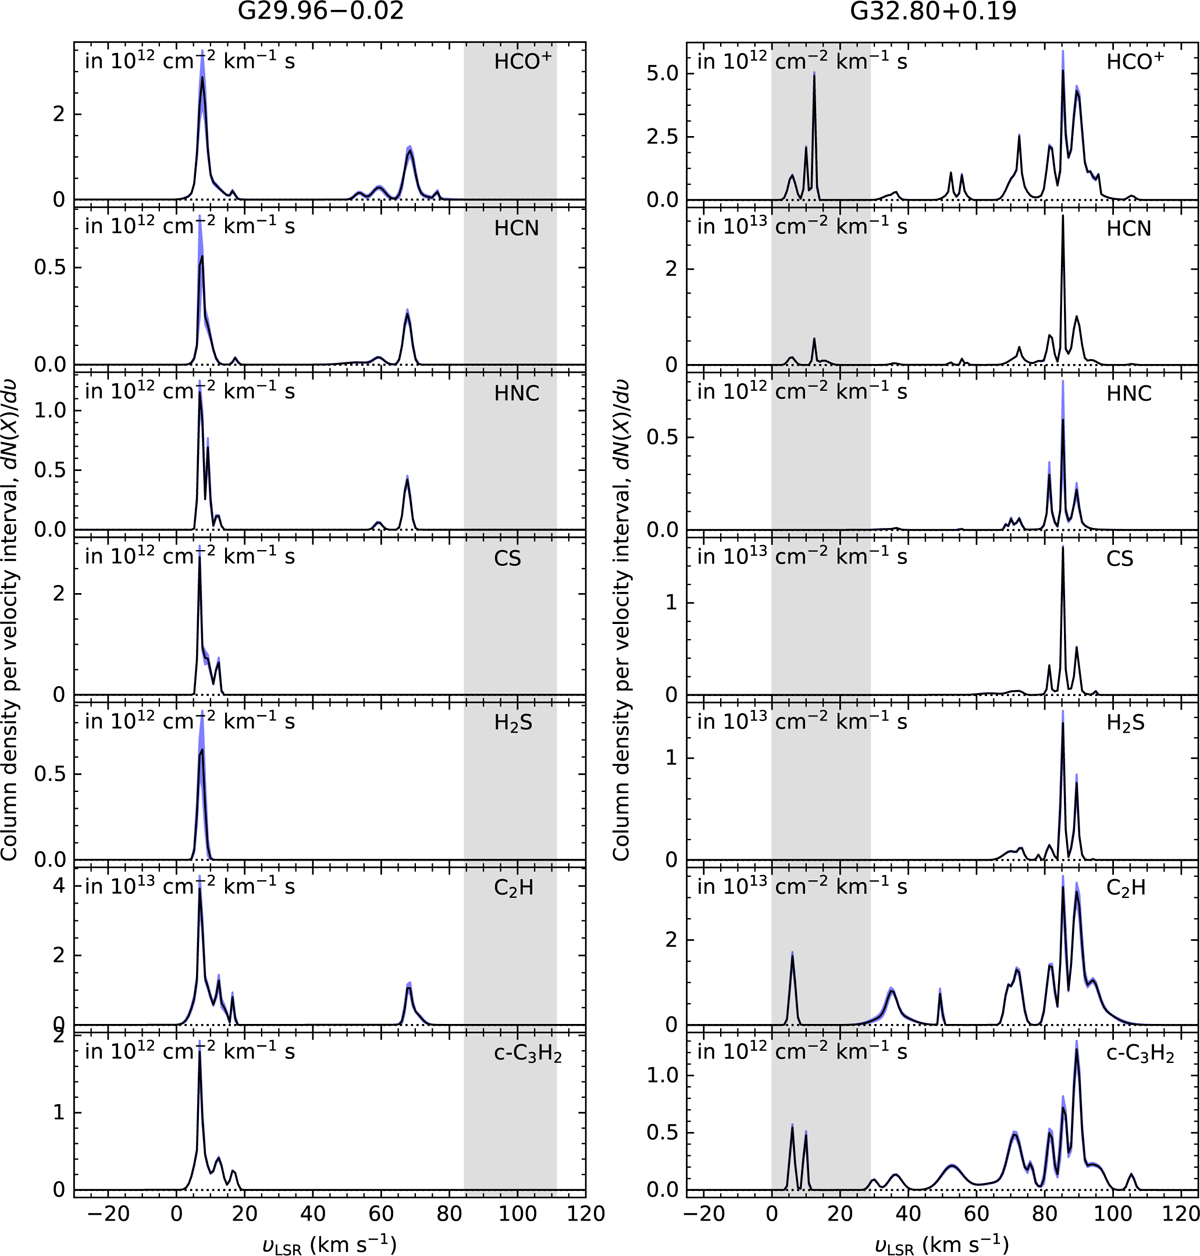
Channel-wise column density spectra (dN/dv) as a function of velocity toward G29.96–0.02 and G32.80+0.19. The dN/dv in each panel shows HCO+, HCN, HNC, CS, H2S, C2H, and c-C3H2 from top to bottom. The gray shaded area indicates velocity range of the HCO+ emission lines. The blue shaded regions represent 2σ confidence intervals for the derived column densities (per velocity interval).
Current usage metrics show cumulative count of Article Views (full-text article views including HTML views, PDF and ePub downloads, according to the available data) and Abstracts Views on Vision4Press platform.
Data correspond to usage on the plateform after 2015. The current usage metrics is available 48-96 hours after online publication and is updated daily on week days.
Initial download of the metrics may take a while.