Fig. 10
Download original image
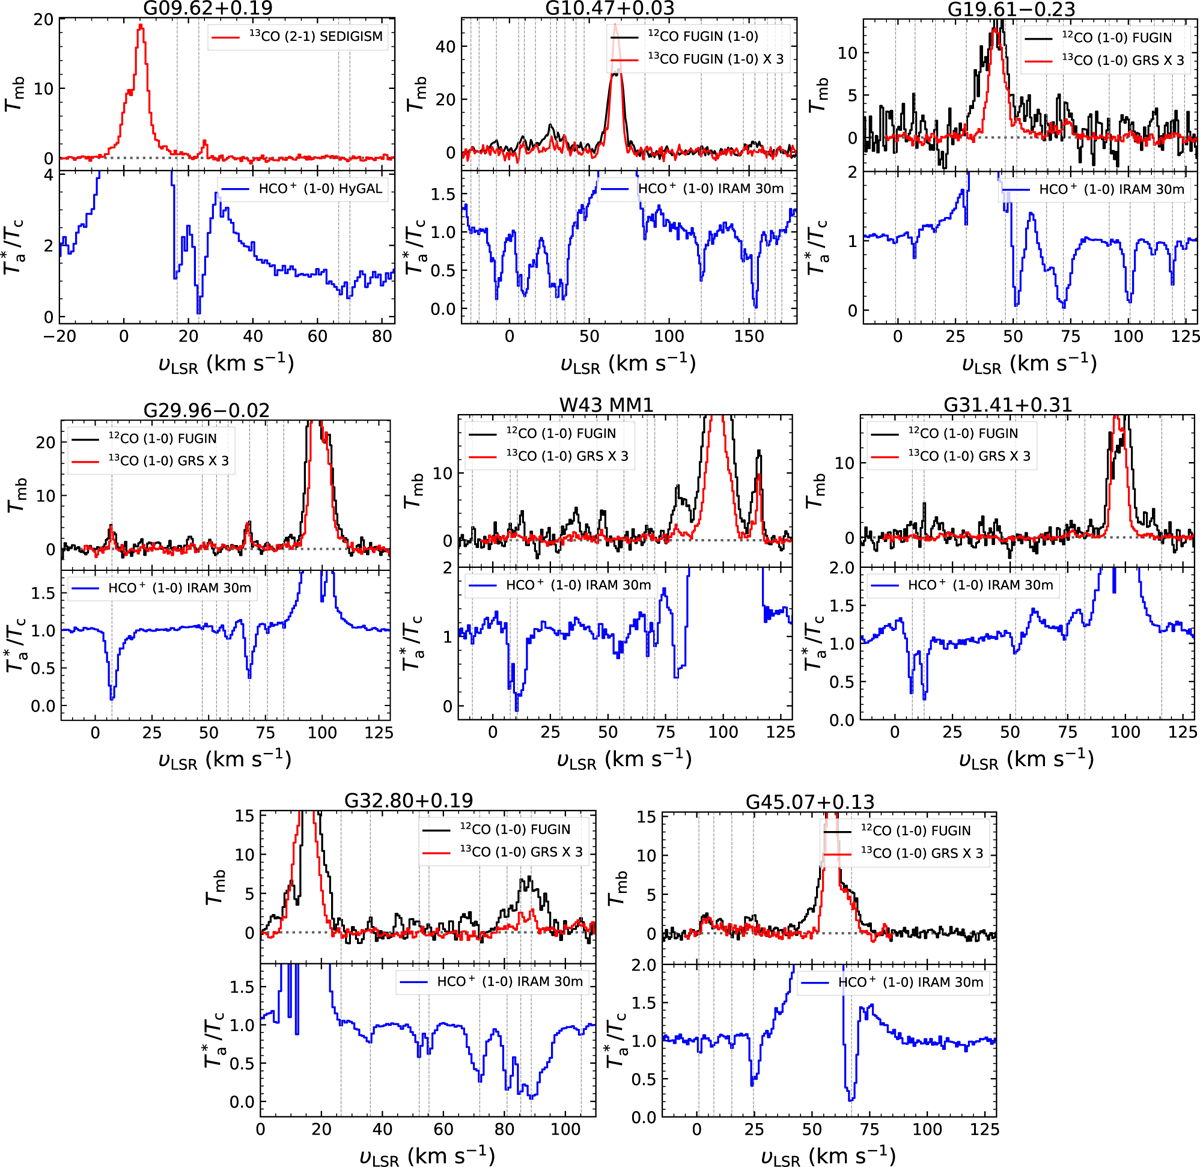
Spectra lines of CO and HCO+ toward the eight sightlines. The upper panel for each plot shows 12CO emission lines (1 → 0) in black, obtained from the FUGIN survey (Umemoto et al. 2017), and 13CO (1 → 0) emission lines in red from the GRS survey (Jackson et al. 2006). For only G09.62+0.19, the 12CO (2 → 1) is taken from the SEDIGISM survey (Schuller et al. 2021). The lower panel for each plot shows absorption and emission lines in HCO+ spectra in blue from this survey. In the both panels, the vertical dotted lines indicate significant absorption features.
Current usage metrics show cumulative count of Article Views (full-text article views including HTML views, PDF and ePub downloads, according to the available data) and Abstracts Views on Vision4Press platform.
Data correspond to usage on the plateform after 2015. The current usage metrics is available 48-96 hours after online publication and is updated daily on week days.
Initial download of the metrics may take a while.