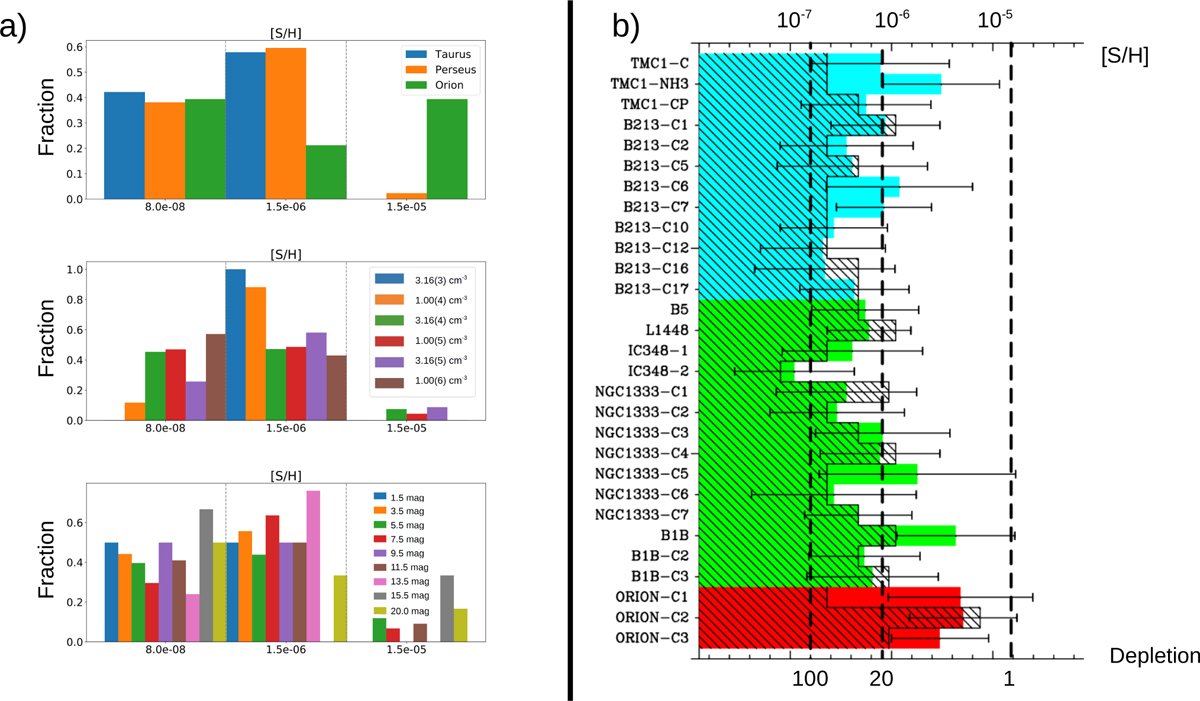
Fig. 6
Download original image
Statistics performed with all the positions (Taurus, Perseus, and Orion) of the molecular database. (a) Histograms with the positions ordered by cloud complex (upper panel), in bins of density (middle panel), and in bins of visual extinction (bottom panel). (b) Mean value of the sulfur elemental abundance derived in each cut. The value of [S/H] toward the high extinction peak is indicated with the dashed area.
Current usage metrics show cumulative count of Article Views (full-text article views including HTML views, PDF and ePub downloads, according to the available data) and Abstracts Views on Vision4Press platform.
Data correspond to usage on the plateform after 2015. The current usage metrics is available 48-96 hours after online publication and is updated daily on week days.
Initial download of the metrics may take a while.