Fig. 1
Download original image
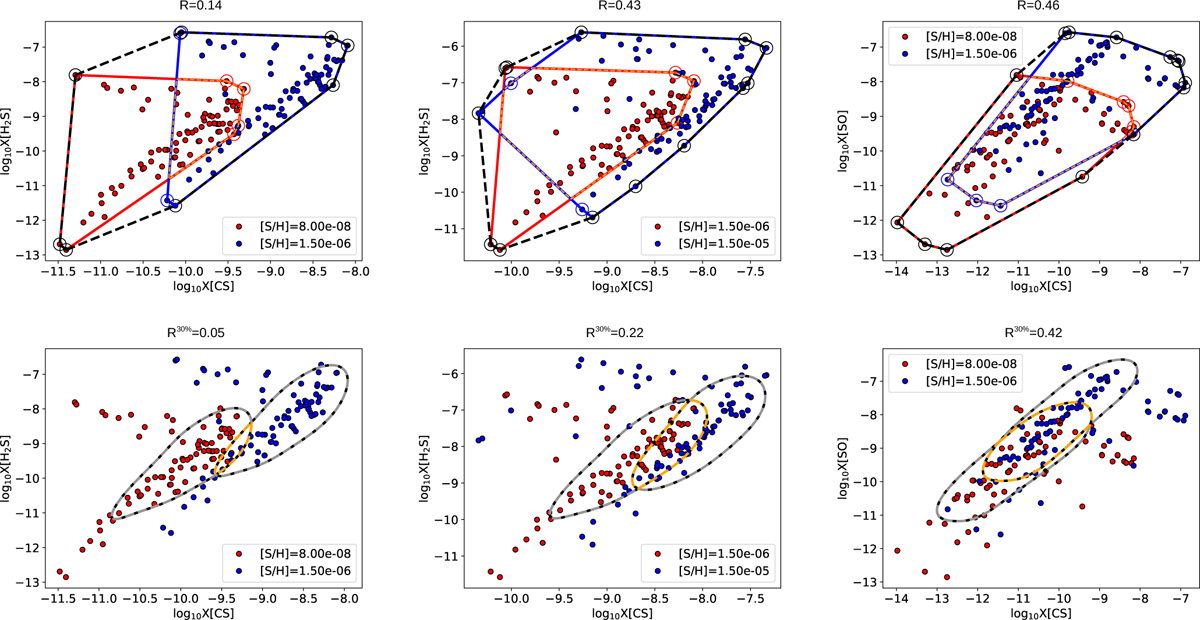
Model clouds formed by selecting all the models with T = 10 Κ and AV = 11.5 mag from the output of the grid listed in Table 2 for Taurus. These models are used to illustrate the calculation of the parameter R (upper panels) and R30% (bottom panels) (see Sect. 4 and Table 3). Upper panels: red and blue lines show the polygons obtained by connecting the extreme values of each [S/H] model cloud. The parameters R is then calculated as the ratio of the red and blue contours intersection area over the total area. Bottom panels: grey lines are iso-density contours corresponding to 30% the point density peak in each model cloud. We show in orange the intersection between the grey contours corresponding to the two values of [S/H]. The parameters R30% is defined as the ratio of the intersection area (area enclosed within the orange contour) over the total area.
Current usage metrics show cumulative count of Article Views (full-text article views including HTML views, PDF and ePub downloads, according to the available data) and Abstracts Views on Vision4Press platform.
Data correspond to usage on the plateform after 2015. The current usage metrics is available 48-96 hours after online publication and is updated daily on week days.
Initial download of the metrics may take a while.